
World Health & Population
The Influence of Birth Spacing on Child Survival in Bangladesh: A Life Table Approach
Shamima Akter, J.A.M. Shoquilur Rahman, Md. Mizanur Rahman and Samad Abedin
Abstract
In this paper we have attempted to demonstrate the relationship between birth spacing and child survival in Bangladesh using data from the 2004 Bangladesh Demographic Health Survey (BDHS). We used standard life table techniques to estimate the probability of child survival and appropriate spacing of births. Logistic regression models were used to investigate the covariates, along with the birth interval that has significant influence on child survival. Study results showed that the probability of child survival was much lower when the preceding birth interval was less than 12 months, and it may be also impeded by a higher birth interval. Child survival probability was highest for a preceding birth interval of 5 years; thereafter, the probability declined. Results of the logistic regression model clearly showed that preceding birth interval was an important and strongly significant factor in explaining infant and child mortality. While education, current age, breastfeeding status and birth order were substantial and highly significant factors both in infant and child mortality, socio-economic factors such as occupation and socio-economic status showed a significant effect only on child mortality. Postponing another child (for a birth interval of 5 years and above) and proper spacing of births would have a noticeable effect in reducing the level of mortality.
Introduction
Researcher and policy makers are interested in the effects of birth spacing on infant, child and maternal health and survival because family planning programs have the potential to affect the timing of pregnancies (Davanzo et al. 2004). The association between short birth intervals and impaired child survival are well established (Boerma and Bicego 1992; Hobcraft et al. 1985; Koening et al. 1990). It is generally accepted that if closely spaced births were delayed, particularly in countries where mortality and fertility are still high, child mortality levels would fall (World Bank 1993). The relationship between short birth intervals and high infant and child mortality has been established in a wide range of populations (e.g., Miller 1991, Miller et al. 1992; Rutstein 2000, 2003). Increasing the interval between births to improve the health of women and children has thus become one of the primary rationales for family planning programs (Locoh 1992; World Bank 1993). Infant and child mortality is a revealing indicator of the impact of government intervention policies and programs, and of socio-economic development in general.
Despite the existence of a large body of evidence on the association between birth spacing and child survival, many questions remain about the strength and nature of the association and the magnitude of mortality reductions. A number of studies of child survival status have been conducted (Alam 1995, 2000; Ezra and Gurum 2002; Majumder et al. 1997; Masanju et al. 2008; Syamala 2004), but very few have dealt with the relationship between birth spacing and child survival status, and none has examined the appropriate spacing of births for optimum child survival. In Bangladesh, the concept of appropriate spacing of births for child survival has rarely been studied. Hence the main objectives of this study are to examine the influence of preceding birth intervals on child survival status by investigating their optimal spacing to reduce infant and child death, and to identify the covariates of mortality.
Data and Methodology
Data used for this study are from the 2003–2004 Bangladesh Demographic and Health Survey (BDHS). BDHS (Mitra et al. 2005) used a two-stage probability sample design to select respondents.The survey recorded a large amount of data on the complete birth history of 11,440 ever married women between 10 and 49 years of age, of whom 10,145 had given birth to at least one child. Life table techniques are considered an appropriate tool to investigate the probability of child death and appropriate spacing for child survival. We used logistic regression to discover the predictors that significantly influence child survival. Regression analysis was performed for only the respondents' most recent child. Data for this study were analyzed using SPSS for Windows (Version 16.0), Statistica (Version 6.0) and Microsoft Excel.
Life Table Analysis
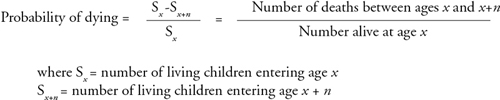
We constructed the life table for a total of 23,184 births of second and higher order for which the length of the preceding birth interval and age at death or survival to third birthday of the index child were known, where the index child is succeeding child. We selected children whose previous sibling had already died before the succeeding conception, yielding a sample size is 5049. Conventional life tables are used to provide an overall idea of influence of birth spacing on child survival. The tables are based on probability of dying and survival up to 3 years, that is, third birth day. In calculating the probability, the numerators are the numbers of children dying and the denominators are the number of children entering each age group. The ratios are, therefore, probabilities of death.
Age-specific probability of dying is calculated as
Logistic Regression Model
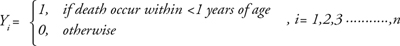
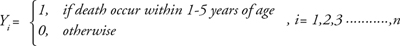
Cox (1958) is the pioneer of logistic regression model. Subsequently, his model was developed further by Walker and Duncan (1967) and Cox himself (1970) and, more recently, by Lee (1980) and Fox (1984). Logistic regression is part of statistical models called generalized linear models. An excellent treatment of generalized models is presented in Agresti (1996). The logistic regression model can be used not only to identify risk factors but also to predict the probability of success. The general logistic model expresses a qualitative dependent variable as a function of several independent variables, both qualitative and quantitative (Fox 1984). Binomial (or binary) logistic regression is a form of regression used when the dependent variable is a dichotomy and the independent variables are of any type. Y is a dichotomous dependent variable that takes values of 0 and 1, as follows:
For infant mortality
For child mortality
There is also a collection of k independent variables, denoted by the vector X′ = (x1 x2 x3 ..… xk)′ and β is a (k+1)+ 1 vector of unknown parameters.
For simplification, we can use the quantity π(X)= P(Y= 1|X), the probability that the event occurs conditional on the value of X. Hence, the basic form for the logistic regression models is
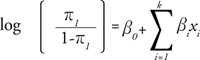
which can also be written as
where, π1 in this case is the probability of death or survival of a child, and βi is the parameter estimated for the intercept and independent variables. The results of logistic regression analysis are given as coefficients, odds ratios (if greater than unity, the probability of surviving rather than dying), and P values, to assess the relative importance of the selected variables.
Results and Discussion
Socio-Demographic Characteristics of the Study Population
Respondents' socio-demographic characteristics are given in Table 1. The majority of the 10,145 participants, 66.0%, lived in rural areas, and only 34.0% lived in urban areas. Altogether, 88.7% were Muslims and 11.3% were non-Muslims (Hindu, Christian and Buddhist).
| Table 1. List of selected socio-economic and demographic variables with percentage, 2003–2004, BDHS, Bangladesh | |||
| Characteristics | Category | Frequency (N) | Percent |
| Respondent age (years) | 1 = ≤24 2 = 25–34 3 = 35 years and more |
2850 3643 3652 |
28.1 35.9 36.0 |
| Age at first marriage (years) | 1 = ≤14 2 = 15–19 3 = 20–24 4 = 25 and above |
5670 3885 499 91 |
53.9 38.3 4.9 0.9 |
| Age at birth (years) | 1 = ≤24 2 = 25–34 3 = 35 years and more |
5126 4156 863 |
50.5 41.0 8.5 |
| Place of residence | 1 = Urban 2 = Rural |
3446 6699 |
34.0 66.0 |
| Religion | 1 = Muslim 2 = Non-Muslim |
9002 1143 |
88.7 11.3 |
| Respondent's education | 1 = No education 2 = Primary 3 = Secondary 4 = Higher |
4187 3044 2371 543 |
41.3 30.0 23.4 5.4 |
| Partner's education | 1 = No education 2 = Primary 3 = Secondary and higher |
3816 2567 3762 |
37.6 25.3 37.1 |
| Respondent's occupation | 1 =Not-working 2 = Working |
7813 2332 |
77.0 23.0 |
| Economic status | 1 = Poor 2 = Middle 3 = Rich |
3702 1889 4554 |
36.5 18.6 44.9 |
| No. of children ever born | 1 = 1–2 2 = 2–4 3 = 5 and above |
4394 3337 2414 |
43.3 32.9 23.8 |
| Breastfeeding status for their child | 1 = Ever 2 = Never |
10,060 85 |
99.2 0.8 |
| Preceding birth intervala (for last child) |
1 = <24 months 2 = 24 and above |
1546 6544 |
19.1 80.9 |
| aThe numbers do not add to 10,145 because 2055 children are first births and have no preceding sibling. | |||
More than half of respondents were married before 15 years of age, and half gave birth at less than age 24. More than two thirds had only primary school education or none at all, and only 5.4% had been educated beyond the secondary school level. Of husbands, 37.6% had no education, while 37.1% had secondary or higher education. A total of 77.0% of respondents were not working (meaning they were engaged only in household work), while 23.0% were gainfully employed. All respondents had given birth to one or more children, and 36.5% belonged to a poor family. About 99% of respondents breastfed their child.
Influence of Preceding Birth Interval on Child Survival
Tables 2 and 3 show the analysis of the influence of the preceding birth interval on child survival and probability of child survival up to 3 years. The tables are both constructed on the same principle: the rows represent different birth intervals of the index children and the columns represent different age groups of the same index children. Each cell represents the mortality experience of a given preceding birth interval for a specific age group. Only children observed during the full 3 years, or who died within the 3 years, in the preceding birth interval (of up to 7 years, or 84 months) and above were included in calculating the probability of dying.
| Table 2. Age-specific probability of dying and survival up to third birthday of index child by length of preceding interval in the study population as a whole, Bangladesh | ||||||||
| Preceding birth interval (months) |
Age at death of index child (months) | Probability of death up to 36 months (n=21251) |
Probability of survival up to 36 months | Percent | ||||
| <1 (n=23184) |
1–5 (n=22262) |
6–11 (n=21864) |
12–23 (n=21649) |
24 –35 (n=21450) |
||||
| <12 | 0.119792 (576) |
0.035503 (507) |
0.022495 (489) |
0.016736 (478) |
0.019149 (470) |
0.19965 (461) |
0.80000 | 2.48 |
| 12–18 | 0.067806 (1873) |
0.025773 (1746) |
0.017049 (1701) |
0.019737 (1672) |
0.018304 (1639) |
0.14095 (1609) |
0.859 | 8.08 |
| 18–24 | 0.056853 (3940) |
0.026911 (3716) |
0.015763 (3616) |
0.015173 (3559) |
0.012839 (3505) |
0.12183 (3460) |
0.878 | 16.99 |
| 24–30 | 0.044328 (3993) |
0.020178 (3816) |
0.012303 (3739) |
0.009207 (3693) |
0.012845 (3659) |
0.09542 (3612) |
0.905 | 17.22 |
| 30–36 | 0.035042 (3453) |
0.019208 (3332) |
0.011628 (3268) |
0.010526 (3230) |
0.009074 (3196) |
0.08283 (3167) |
0.917 | 14.89 |
| 36–42 | 0.028125 (2560) |
0.013264 (2488) |
0.005295 (2455) |
0.006552 (2442) |
0.013603 (2426) |
0.065234 (2393) |
0.936 | 11.04 |
| 42–48 | 0.020219 (1830) |
0.009481 (1793) |
0.004505 (1776) |
0.00509 (1768) |
0.002843 (1759) |
0.04153 (1754) |
0.958 | 7.89 |
| 48–54 | 0.016393 (1281) |
0.011905 (1260) |
0.001606 (1245) |
0.003218 (1243) |
0.001614 (1239) |
0.03435 (1237) |
0.966 | 5.53 |
| 54–60 | 0.01466 (955) |
0.004251 (941) |
0.004269 (937) |
0.003215 (933) |
0.001075 (930) |
0.02722 (929) |
0.973 | 4.12 |
| 60–66 | 0.019374 (671) |
0.004559 (658) |
0.001527 (655) |
0.006116 (654) |
0.004615 (650) |
0.03577 (647) |
0.964 | 2.89 |
| 66–72 | 0.025295 (593) |
0.013841 (578) |
0.001754 (570) |
0.000000 (569) |
0.001761 (568) |
0.04384 (567) |
0.956 | 2.56 |
| 72–78 | 0.026737 (374) | 0.010989 (364) |
0.008333 (360) |
0.000000 (357) |
0.002801 (357) |
0.04813 (356) |
0.952 | 1.61 |
| 78–84 | 0.022201 (318) |
0.022508 (311) |
0.003289 (304) |
0.000000 (303) |
0.0033 (303) |
0.05031 (302) |
0.950 | 1.37 |
| 84+ | 0.022164 (767) |
0.021333 (750) |
0.00545 (734) |
0.000 (730) |
0.00274 (730) |
0.05085 (728) |
0.949 | 3.31 |
| Total | 0.039769 (23,184) |
0.017878 (22,262) |
0.009834 (21,864) |
0.009192 (21,649) |
0.009277 (21,450) |
.08338 (21,251) |
0.917 | 100 |
| Note. "Index child" means the succeeding child. | ||||||||
| Table 3. Age-specific probability of dying and survival up to third birthday of index child by length of preceding birth interval, where preceding child died before conception of the index child, Bangladesh | ||||||||
| Preceding birth interval | Age at death of index child (months) | Probability of death up to 36 months (n=3143) |
Probability of survival up to 36 months | Percent | ||||
| <1 (n=4479) |
1–5 (n=4123) |
6–11 (n=3720) |
12–23 (n=3568) |
24–35 (n=3332) |
||||
| <12 | 0.385604 (778) |
0.200837 (478) |
0.10733 (382) |
0.205279 (341) |
0.184502 (271) |
0.7159 (221) |
0.284062 | 17.37 |
| 12–18 | 0.178132 (1381) |
0.096916 (1135) |
0.051707 (1025) |
0.063786 (972) |
0.062637 (910) |
0.38233 (853) |
0.617668 | 30.83 |
| 18–24 | 0.183755 (751) |
0.088091 (613) |
0.042934 (559) |
0.065421 (535) |
0.054000 (500) |
0.37017 (473) |
0.629827 | 16.77 |
| 24–30 | 0.151079 (695) |
0.110169 (590) |
0.032381 (525) |
0.064961 (508) |
0.069474 (475) |
0.36403 (442) |
0.635971 | 15.52 |
| 30–36 | 0.177215 (316) |
0.080769 (260) |
0.029289 (239) |
0.051724 (232) |
0.072727 (220) |
0.3544 (204) |
0.645570 | 7.06 |
| 36–42 | 0.143617 (188) |
0.111801 (161) |
0.013986 (143) |
0.085106 (141) |
0.046512 (129) |
0.34574 (123) |
0.654255 | 4.20 |
| 42–48 | 0.212121 (99) |
0.076923 (78) |
0.041667 (72) |
0.086957 (69) |
0.000000 (63) |
0.36363 (63) |
0.636364 | 2.21 |
| 48–54 | 0.200000 (60) |
0.083333 (48) |
0.022727 (44) |
0.069767 (43) |
0.050000 (40) |
0.3667 (38) |
0.633333 | 1.34 |
| 54–60 | 0.207547 (53) |
0.142857 (42) |
0.000000 (36) |
0.055556 (36) |
0.058824 (34) |
0.3962 (32) |
0.603774 | 1.18 |
| 60–66 | 0.264151 (53) |
0.205128 (39) |
0.032258 (31) |
0.033333 (30) |
0.068966 (29) |
0.4906 (27) | 0.509434 | 1.18 |
| 66–72 | 0.250000 (32) |
0.208333 (24) |
0.105263 (19) |
0.000000 (17) |
0.058824 (17) |
0.500000 (16) |
0.500000 | 0.71 |
| 72–78 | 0.333333 (18) |
0.250000 (12) |
0.000000 (9) |
0.000000 (9) |
0.000000 (9) |
0.50000 (9) |
0.500000 | 0.40 |
| 78–84 | 0.375000 (8) |
0.200000 (5) |
0.000000 (4) |
0.00000 (4) |
0.000000 (4) |
0.50000 (4) |
0.500000 | 0.17 |
| 84+ | 0.319149 (47) |
0.18750 (32) |
0.038462 (26) |
0.00000 (25) |
0.080000 (25) |
0.5106 (23) |
0.489362 | 1.05 |
| Total | 0.183403 (4479) |
0.097744 (4123) |
0.04086 (3720) |
0.066143 (3568) |
0.059424 (3332) |
0.30029 (3134) |
0.6997 | 100 |
| Note. "Index child" means the succeeding child. | ||||||||
Table 2 shows that birth intervals of less than 12 months and greater than 60 months were uncommon (2.5% and 2.9%, respectively). After a 60-month (5-year) interval, the number of birth decreased still further, to 2.6% at the 66- to 72-month interval and to 1.6% at the 72- to 78-month interval. Subsequent periods saw further declines. The greatest number of births occurred between 18 and 24 months (17%) and between 24 and 30 months (17.2%).
Age-specific probability of dying was highest for a birth interval of less than 12 months and lowest for an interval of between 54 and 60 months. Probability of surviving to the child's third birthday ranged from a low of 0.800 for an interval of less than 12 months to a high of 0.973 when the interval was 54 to 60 months (Figure 1). After 5 years the probability of survival decreases monotonically, so a birth interval longer than 5 years substantially reduced the likelihood of child survival. Several studies have argued with this interpretation of child survival (Davanzo et al. 2004). As shown in Figure 1, the survival curve depicts an increasing trend for birth intervals of up to 54 to 60 months, where a 97.7% chance of survival is indicated; thereafter the curve shows a moderately decreasing trend. The curve illustrates the lower probability of survival when birth intervals were less than 12 months and the much higher survival probability for intervals of 54 to 60 months.

Figure 2 reveals that the probability of dying for different age groups shows a monotonically decreasing trend. Probability of death was greatest for infants less than a month old and was particularly high for those born at a preceding interval of less than 12 months. The downward trend continues to the 54- to 60-month interval.

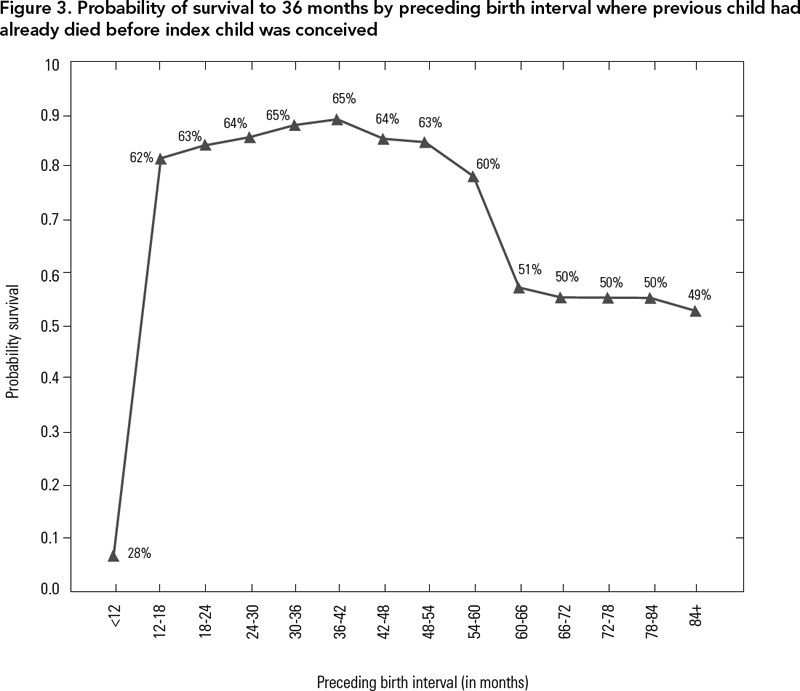
Table 3 shows the influence of the preceding birth interval on child survival when the preceding child had already died before the succeeding conception (index child) occurred. In this case, preceding intervals tended to be shorter (compare with Table 2) and probability of survival was highest at 3 or 3 1/2 years. Several countries have already begun the 3-year spacing message (Davanzo et al. 2004). Here, most births (30.8%) took place in the 12- to 18-month interval. Possible reasons for this spacing are that mothers whose children have died tend to replace them as quickly as possible, or have reduced durations of breastfeeding and amenorrhea. Figure 3 depicts the trend of probability of survival. For a preceding interval of less than 12 months, the chance of survival is low (28%), but the trend increases very rapidly for a preceding interval of 12 to 18 months (62%), gradually increasing to an interval of 36 to 42 months (65%). After 42 months the probability of survival again shows a decreasing trend. Differences in the magnitude of effects of the preceding birth interval on child survival is observed in Tables 2 and 3. One explanation is that parents are more aware of child survival, as their previous child has already dead. Risk of child death may be impeded for a short preceding birth interval because parents may place greater value on children and be more conscious of childcare practices, diet and disease. Nonetheless, further research examining differences in appropriate birth spacing as well as on biological explanations to better understand mortality differentials is needed.
Determinants of Mortality
To better understand the contribution of the preceding birth interval and each of the socio-demographic factors on the dependent variable – survival status or mortality – we undertook a multivariate analysis using the logistic regression model. Logistic regression was performed considering infant (0–11months) and child mortality (1–5 years). Results for the models are summarized in Tables 4 and 5.
| Table 4. Logistic regression estimate for the effect of preceding birth interval and socio-demographic factors on infant mortality, Bangladesh | ||||
| Explanatory variables | Coefficients (β) | S.E. (β) | Relative risk | 95% CI |
| Place of residence Rural Urban |
0.254 | 0.134 | 1.000 1.290 |
0.992–1.6775 |
| Education* No education Primary Secondary Secondary and higher |
1.773 1.506 1.029 |
0.645 0.646 0.654 |
5.890 4.507 2.797 1.00 |
1.663–20.870 1.271–15.989 0.777–10.070 |
| Religion** Muslim Non-Muslim |
0.395 | 0.177 | 1.000 1.484 |
1.048–2.101 |
| Respondents occupation Non-working Working |
0.230 | 0.136 | 1.000 1.258 |
0.964–1.642 |
| Current age (years)* ≤24 25–34 35+ |
-0.218 0.274 |
0.246 0.259 |
1.000 0.804 1.315 |
0.496–1.302 0.732–2.183 |
| Age at birth ≤24 25–34 35+ |
0.389 0.360 |
0.189 0.259 |
1.476 1.433 1.000 |
1.019–2.138 0.833–2.378 |
| Preceding birth interval* ≤24 months >24 months |
-0.594 | 0.137 | 1.00 0.552 |
0.422–0.722 |
| Breastfeeding* Ever Never |
4.924 | 0.355 | 1.00 137.506 |
68.623–275.533 |
| Age at marriage ≤14 15–19 20–24 25+ |
0.018 -0.156 -0.273 |
0.134 0.389 0.751 |
1.00 1.018 0.856 1.314 |
0.734–1.322 0.400–1.833 0.302–5.723 |
| Socio-economic status Poor Middle Higher |
-0.110 -0.014 |
0.171 0.151 |
1.00 0.896 0.986 |
0.641–1.253 0.734–1.325 |
| Birth order** ≤2 3–5 6+ |
0.027 0.473 |
0.191 0.240 |
1.00 1.028 1.605 |
0.707–1.494 1.003–2.568 |
| Constant | -5.034 | 0.679 | 0.007 | |
| CI = confidence interval; S.E. = standard error. | ||||
| Model x2: 361.19; d.f.: 19; Cox & Snell R-square: 0.044. | ||||
| *Significant at the 1% level. | ||||
| **Significant at the 5% level. | ||||
| Table 5. Logistic regression estimate for the effect of preceding birth interval and socio-demographic factors on child mortality, Bangladesh | ||||
| Explanatory variables | Coefficients (β) | S.E. (β) | Relative risk | 95% CI |
| Place of residence Rural Urban |
-0.068 | 0.166 | 1.00 0.935 |
0.674–1.295 |
| Education** No education Primary Secondary Secondary and higher |
1.600 1.307 1.204 |
1.028 1.030 1.037 |
4.951 3.696 3.333 1.00 |
0.660–37.164 0.491–27.842 0.437–25.421 |
| Religion Muslim Non-Muslim |
-0.022 | 0.234 | 1.000 0.978 |
0.618–1.548 |
| Respondents occupation* Non-working Working |
0.437 | 0.151 | 1.000 1.548 |
1.152–2.079 |
| Age (years)* ≤24 25–34 35+ |
0.052 0.769 |
0.295 0.305 |
1.000 1.054 2.158 |
0.591–1.879 1.186–3.928 |
| Age at birth ≤24 25–34 35+ |
0.110 0.091 |
0.213 0.287 |
1.000 1.117 1.096 |
0.735–1.696 0.625–1.922 |
| Preceding birth interval* ≤24 months >24 months |
-0.483 | 0.160 | 1.00 0.617 |
0.451–0.844 |
| Breastfeeding* Ever Never |
2.544 | 0.338 | 1.00 12.726 |
6.565–24.668 |
| Age at marriage ≤14 15–19 20–24 25+ |
0.139 -1.097 -0.116 |
0.152 0.729 1.037 |
1.00 1.150 0.334 0.890 |
0.853–1.550 0.080–1.394 0.117–6.795 |
| Socio-economic status* Poor Middle Higher |
-0.306 -0.577 |
0.191 0.184 |
1.00 0.736 0.561 |
0.507–1.070 0.391–.805 |
| Birth order** ≤2 3–5 6+ |
0.037 0.516 |
0.225 0.277 |
1.00 1.038 1.676 |
0.668–1.613 0.974–2.885 |
| Constant | -5.217 | 1.059 | 0.005 | |
| CI = confidence interval; S.E. = standard error. | ||||
| Model x2:165.145; d.f.: 19; Cox & Snell R-square: 0.020. | ||||
| *Significant at the 1% level. | ||||
| **Significant at the 5% level. | ||||
Infant Mortality
Table 4 shows the results of logistic regression analysis for infant mortality along with regression co-efficient (β) and standard error. The odds ratios (exponential of the regression co-efficient) and 95% confidence interval are also presented for each variable in the study. From the table, we observe that respondent education, religion, current age, preceding birth interval, breastfeeding status and birth order showed a significant effect on infant mortality for the variables studied.
Mothers' education had a strong significant effect on risk of infant mortality. Table 4 shows that compared with infants of mothers with higher education, the risk of mortality was 6 times higher for infants whose mother had no education, 5 times higher when mothers had only primary education and 3 times higher when mothers had secondary education. In developing countries, mothers' educational level tends to have a strong effect on the mortality of infant children (Govindasamy and Ramesh 1997; Hobcraft et al. 1984; Mosley and Chen 1984; Omariba et al. 2007; United Nations 1985, 1991, 1998). Literate mothers usually give birth to healthier babies because they themselves tend to be healthier than mothers who are illiterate. In addition, literate mothers are more likely than illiterate mothers to provide their children with a healthier environment and nutritious food, even when other conditions are similar. Lastly, better-educated mothers are likely to have more information about healthcare facilities and more influence within the family in deciding to take sick children for treatment. These traits are likely to result in lower mortality of children at all ages under 5 years (Caldwell 1992; Cleland and Kaufman 1993; World Bank 1993).
Regarding religion, children of Muslim mothers were about 48% more likely to die in infancy than children of non-Muslim mothers. Children born to mothers under 24 or over 35 years of age were more likely to have elevated risks of mortality than mothers aged 24 to 35 years. We observed that the risk of infant mortality was 20% lower for mothers in the medium age group (25–34) and 1.315 times higher for older age (35+) mothers than for the younger age group (≤24 years). Younger mothers are not yet ready to take parental responsibilities, may not have decision-making authority in the household and lack financial resources to seek medical care for their children (Alam 2000).
An adverse effect of short preceding birth interval is observed in this model, where children born 24 months after their preceding siblings were 45% less likely to die compared to those born less than 24 months after preceding siblings. Thus when birth interval increased, the relative risk of mortality decreased.
Breastfeeding status of the mother showed a strong significant effect on mortality risk in infancy. The chance of survival at the neonatal period was much higher for babies who ever breastfed: relative risk of mortality was 137.50 times higher for babies who never breastfed than for those who ever breastfed. Considerable reduction in mortality risk is associated with breastfeeding, especially in a society where poverty is rampant and prolonged breastfeeding is a norm. Nonetheless, the role of breastfeeding in reducing mortality risk of children and in prolonging birth intervals, which in turn plays a role of fertility reduction, should be emphasized.
Risk of mortality was 1.028 times higher for birth order 3 to 5 and 1.605 times higher for birth order 6+ compared with birth order 1 to 2. Thus we see that mortality risk increased with the increase in birth order. During these stages of child development, mortality is more likely to depend on the care children receive than on biological factors. Children of high-order births face competition from older siblings for food and parental attention. They also face exposure to infectious childhood diseases from their siblings. In addition, the mother's nutritional status, which affects birth weight and lactation, may decrease with high birth orders (Rah et al. 2008).
Child Mortality
Results showing relationships between child mortality and different factors are presented in Table 5. This table considers the same variables as Table 4. From these tables, we observe that along with other covariates significantly influencing infant mortality, respondent occupation and socio-economic status showed significant effect, while the effect of religion was insignificant. Socio-economic variables had greater influence on child mortality than on infant mortality. Since we have already described results for infant mortality, in this section we provide an overview of the patterns shown in the table, comparing them with results for infant mortality where appropriate.
In infancy, the risk of death was 6 times higher when the mother had no education than when the mother had higher education; in childhood this risk fell to 5 times. The pattern was maintained for all educational groups. Mother's literacy emerged as an important factor associated with mortality during infancy and childhood. The estimated effects of maternal education on child mortality correspond closely to findings from other studies (Desai and Alva 1998; Omariba et al. 2007; Rutstein 2000).
Respondent occupation showed a strong significant effect for child mortality but an insignificant result for infant mortality. In childhood mortality, the risk was 1.548 times higher for children of working mothers than for those of non-working mothers.
Current age of the respondent demonstrated a highly significant effect on risk of death both in infancy and childhood. Compared with that of younger mothers (≤24 years), the risk of mortality was 1.054 times higher for children of mothers in the middle age group (25–34) and more than doubled for children of older-aged (35+) mothers.
Preceding birth interval also showed a highly significant negative effect on mortality in childhood. The risk of infants and child mortality were (1-0.552)*100= 45% and (1-0.617)*100=38% lower for preceding birth intervals > 24 months as compared with birth intervals lower than 24 months.
Breastfeeding status of child also showed a strong significant effect on mortality risk of children. The relative risk of mortality for never breastfed children was much higher in infancy than in childhood. For childhood the risk of mortality was about 13 times higher; risk of mortality for infants who were never breastfed was 138 times higher than for infants who were ever breastfed. Breastfeeding is a unique source of nutrition that plays an important role in infant growth, development and survival, particularly in poorer environments where the early introduction of other milk is of particular concern.
Respondents' socio-economic status showed a significant effect on mortality risk in childhood but not in infancy. Relative risk of mortality was 26% lower for children of middle-class respondents, and 44% lower for children of higher-class respondents, than for those of poor respondents.
Birth order showed significant effect on mortality risk both in infancy and in childhood. The magnitude of effects of birth order remained largely unchanged in both cases. Higher birth order always shows increasing risk of mortality. The immature reproductive systems of young mothers, and the depleted physiological system of older mother due to repeated pregnancies, make them susceptible to pregnancy complications and bearing low-birth-weight babies (Miller 1993). Both conditions are associated with a higher risk of child death (Solis 2000).
Conclusion
Our study mainly examined the influence of preceding birth interval on child survival and investigated determinants of mortality in both infancy and childhood. The life table method demonstrated that the probability of survival was much higher for longer birth intervals (54–60 months). Survival probability was lowest for short birth intervals (below 12 months) for the whole study population. Generally, we may conclude that birth intervals of 60 months and above are the standard for a new child. Birth intervals were much lower and maximum births occurred before 18 months for women whose previous child had already died before conception of the next, the index child. Probability of dying was highest for infants less than a month old with a short birth interval. A short birth interval increased the risk of both infant and child mortality. It is very difficult to explain the probability of survival for a child when the preceding child had already died before the next was conceived.
One of the major limitations of this study is that it failed to give biological explanations for mortality because of lack of information. The logistic regression model identified that respondent education, religion, current age, preceding birth interval, breastfeeding status and birth order significantly influenced mortality in infancy. For childhood mortality, respondent education, working status, socio-economic status, current age, preceding birth interval, breastfeeding status and birth order showed a significant effect. So along with demographic variables, socio-economic variables had more influence on child mortality than on infant mortality. Although this study has demonstrated that child and infant mortality risk vary because of some socio-demographic variables, the analysis did not include healthcare factors; the information was not available in the collected data. Exclusion of this important determinant therefore inflated the magnitude of the effect, which is another limitation of this study. However the findings of the present study suggest some policy implication to mitigate child mortality.
Intervention policies should encourage women and couples to adopt appropriate birth spacing (5 years and above) in order to reduce child death in an impoverished society. Education appears to be the key factor, through various causal mechanisms. Education delays marriage, and the maturity that comes with age may result in more effective contraception, so influencing the birth interval. Education also increases the opportunity for paid employment in the modern economy, and this competes with the demand for child-bearing. Through increasing her odds of becoming employed outside the home and thus becoming an income-producing member of the family, a woman is more likely to acquire a role in decisions concerning all aspects of family life, including the number and spacing of her children. Hence we can conclude tentatively that an improvement in female education levels will help increase birth intervals and breastfeeding practices, thereby reducing infant and child mortality. To realize these benefits, the government should provide free and compulsory education for children up to 14 years of age.
About the Author(s)
Shamima Akter PhD, Department of Population Science and Human Resource Development, University of Rajshahi, Rajshahi-6205, Bangladesh
Dr. J.A.M. Shoquilur Rahman, Associate Professor, Department of Population Science and Human Resource Development, University of Rajshahi, Rajshahi-6205, Bangladesh
Md. Mizanur Rahman, Assistant Professor, Department of Population Science and Human Resource Development, University of Rajshahi, Rajshahi-6205, Bangladesh
Professor Samad Abedin, Professor, Department of Statistics, University of Rajshahi, Rajshahi-6205, Bangladesh
Correspondence may be directed to: Dr. J.A.M. Shoquilur Rahman, Associate Professor, Department of Population Science and Human Resource Development, University of Rajshahi, Rajshahi-6205, Bangladesh. E-mail: shahin67_ru@yahoo.com
References
Agresti, A. 1996. An Introduction to Categorical Data Analysis. New York: John Wiley and Sons, Inc.
Alam, N. 1995. "Birth Spacing and Infant and Early Childhood Mortality in a High Fertility Area of Bangladesh: Age-Dependent and Interactive Effects." Journal of Biosocial Science 27(4): 393–404.
Alam, N. 2000. "Teenage Motherhood and Infant Mortality in Bangladesh: Maternal Age-Dependent Effect of Parity One." Journal of Biosocial Science 32(2): 229–36.
Boerma, J.T. and T.G. Bicego. 1992. "Preceding Birth Interval and Child Survival: Searching for Pathways of Influence." Studies in Family Planning 23(4): 243–56.
Caldwell J.C (1992). "Old and new factors in health transitions." Health transition Review 2: 205-215
Cleland, J. and G. Kaufmann. 1993, November 10–14. "Education, Fertility and Child Survival: Unraveling the Links." Paper presented at a workshop of the International Union for the Scientific Study of the Population IUSSP), held in Barcelona, Spain.
Cox, D.R. 1958. "The Regression Analysis of Binary Sequences." Journal of the Royal Statistical Society Series B 20: 215–42.
Cox, D.R. 1970. The Analysis of Binary Data. London: Methuen, Chapman and Hall.
Davanzo, J, A. Razzaque, M. Rahman and L. Hale, with K. Ahmed, M.A. Khan, G. Mustafa and K. Gausia. 2004. The Effects of Birth Spacing on Infant and Child Mortality, Pregnancy Outcomes and Maternal Morbidity and Mortality in Matlab, Bangladesh. Working Paper-198. RAND Labour and Population.
Desai, S. and S. Alva. 1998. "Maternal Education and Child Health: Is There a Strong Causal Relationship?" Demography 35(1): 71–81.
Ezra, M. and E. Gurum. 2002. "Breastfeeding, Birth Intervals and Child Survival: Analysis of the 1997 Community and Family Survey Data in Southern Ethiopia." Ethiopian Journal of Health Development 16(1): 41–51.
Fox, J.D. 1984. Linear Statistical Models and Related Methods. New York: Wiley.
Govindasamy, P. and B.M. Ramesh. 1997. Maternal Education and the Utilization of Maternal and Child Health Services in India. National Family Health Survey Subject Report, No. 5. Mumbai: International Institute for Population Sciences; and Calverton, MD: Macro International.
Hobcraft, J.N. J.W. McDonald and Rutstein. 1985. "Demographic Determinants of Infant and Early Child Mortality: A Comparative Analysis." Population Studies 39(3): 363–85.
Koenig, M.A., J.F. Philllips, O.M. Campbell and S. D'Suza. 1990. "Births Interval and Childhood Mortality in Rural Bangladesh." Demography 27(2): 251-65.
Lee, E.T. 1980. Statistical Methods for Survival Data Analysis. Belmont, CA: Lifetime Learning Publications.
Lokoh, T. 1992. Vingt ans de planification familiale an Afrique Sub-Saharienne. Les Dossiers du CEPED No.19. Paris: CEPED, 1992.
Majumder, AK., M. May and P. Dev Pant. 1997. "Infant and Child Mortality Determinants in Bangladesh: Are They Changing?" Journal of Biosocial Science 29: 385–99.
Masanja, H., D. Savigny, P. Smithson, J. Schellenberg, T. John, C. Mbuya, G. Upunda, C.T. Boerma, C. Victora, T. Smith and H. Mshinda. 2008. "Child Survival Gains in Tanzania: Analysis of Data from Demographic and Health Surveys." The Lancet 371(9620): 1276–83.
Miller, J.E. 1991. "Birth Interval and Perinatal Health: An Investigation of Three Hypotheses." Family Planning Perspectives 23(2): 62–70.
Miller, J.E. 1993. "Birth Outcomes by Mother's Age at Birth in the Philippines." International Family Planning Perspectives 19(3): 98–102.
Miller, J.E., J. Trussell, A.R. Pebley and B. Vaughan. 1992. "Birth Spacing and Child Mortality in Bangladesh and the Philippines." Demography, 29 (2): 305–18.
Mitra, S. N., A. Al-Sabir, S. Islam, S. K. Bhadra, A.R. Cross and S. Kumar. 2005. Bangladesh Demographic and Health Survey, 2004. National Institute of Population Research and Training (NIPORT), Dhaka, Bangladesh.
Mosley, W.H. and L. Chen. 1984. "An analytical framework for the study of child survival in developing countries". In W.H. Mosley and L. Chen, eds., Child Survival: Strategies for Research. Population and Development Review 10 (Suppl.): 25-45.
Hobcraft, J.N., J.W. McDonald and S.O. Rutstein. 1984. "Socio-economic Factors in Infant and Child Mortality: A Cross National Comparison." Population Studies 38: 193–23.
Omariba, D.W.R., R. Beaujot and F. Rajulton. 2007. "Determinants of Infant and Child Mortality in Kenya: An Analysis Controlling for Frailty Effects." Population Research & Policy Review 26(3): 299–321.
Rah, J.H. Christian P., Shamim A.A. Arju U.T. Labrique A.B. and Rashid M. 2008. "Pregnancy and Lactation Hinder Growth and Nutritional Status of Adolescent Girls in Rural Bangladesh." JN The Journal of Nutrition. 138:1505-1511.
Rutstein, S. July 2000. Effect of Birth Intervals on Mortality and Health: Multivariate Cross Country Analysis (presentation). Washinton DC: USAID, ORC Macro International, Inc. Calverton Maryland.
Rutstein, S. 2003. "Effect of Preceding Birth and Pregnancy Intervals on Child Mortality and Nutritional Status in Less Developed Countries: Evidence from the Demographic and Health Surveys." ORC Macro International. Unpublished paper.
Solis, P., S.G. Pullul and W.P. Frisbie. 2000. "Demographic Models of Birth Outcomes and Infant Mortality: An Alternative Approach." Demography 37(4): 489–98.
Syamala, T.S. 2004. "Relationship between Socio-demographic Factors and Child Survival: Evidence from Goa, India." Journal of Human Ecology 16(2): 141–5.
United Nations. 1985. Socioeconomic Differentials in Child Mortality in Developing Countries. New York: United Nations.
United Nations. 1991. Child Mortality in Developing Countries: Socio-economic Differentials, Trends, and Implications. New York: United Nations.
United Nations. 1998. Family building and Family Planning Evaluation. New York: Department of Economic and Social Affairs. New York: United Nations, Population Division.
Walker, S.H. and D.B. Duncan. 1967. "Estimation of the Probability of an Event as a Function of Several Independent Variables." Biometrica 54: 167–79.
World Bank. 1993 World Development Report 1993. Investing in Health. New York: Oxford University Press.
Comments
Be the first to comment on this!
Personal Subscriber? Sign In
Note: Please enter a display name. Your email address will not be publically displayed