
Healthcare Policy
Diagnosing Senescence: Contributions to Physician Expenditure Increases in British Columbia, 1996/97 to 2005/06
Kimberlyn M. McGrail, Robert G. Evans, Morris L. Barer, Kerry J. Kerluke and Rachael McKendry
Abstract
Conventional wisdom holds that Canada suffers from a physician shortage, yet expenditures for physicians' services continue to increase rapidly. We address this apparent paradox, analyzing fee-for-service payments to physicians in British Columbia in 1996/97 and 2005/06. Age-specific per capita expenditures (adjusted for fee changes) rose 1% per year over this period, adding $174 million to 2005/06 expenditures. We partition these increases into changes in the proportion of the population seeing a physician; the number of unique physicians seen; the number of visits per physician; and the average expenditure per visit. Expenditures on laboratory and imaging services, particularly for the elderly and very elderly, have increased dramatically. By contrast, primary care services for the non-elderly appear to have declined. The causes and health consequences of these large changes deserve serious attention.
Physician services in Canada present a puzzle with major implications for access to and costs of medical care, as well as for physician supply policy. In this paper, we present a partial resolution of that puzzle and draw out some of the inferences.
On the one hand, "everyone knows" that Canada suffers from a severe shortage of physicians. This shortage is an article of faith in the media and in public discourse (Ubelacker 2008); it is deplored by medical schools and medical associations (Tam 2008; Canadian Press 2008; Feasby 2008), and the experience of individual patients who cannot find a family doctor provides ground truthing ("No New Medical Practices" 2006; McLaughlin 2005).
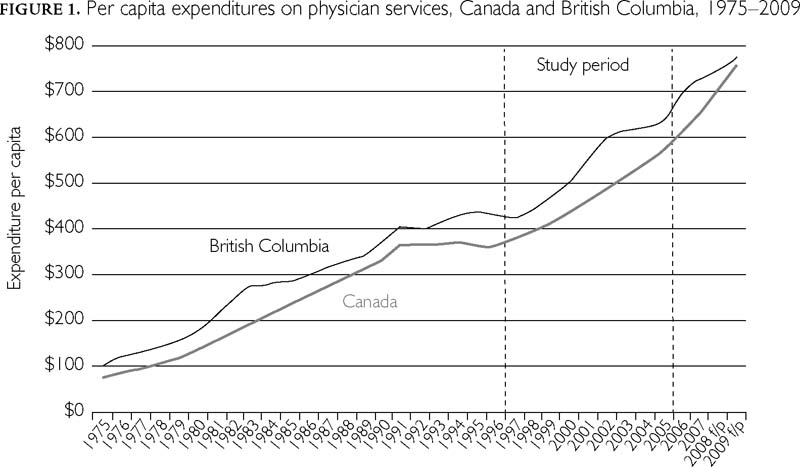
Equally obvious, however, though almost totally ignored in the public discourse, is the fact that expenditures for physicians' services in Canada have been rising rapidly, reaching more than $25 billion in 2009 (CIHI 2009). On a per capita basis, expenditures on physician services have been rising since at least 1975, plateauing only briefly in the early 1990s (Figure 1). The years under study here, 1996/97 through 2005/06, start at the end of this period of restraint. Since then, expenditures per capita in Canada have more than doubled, from $363 to $770, an average annual rate of increase of 5.1%. Some of this increase reflects general price inflation, but adjusting for increases in the Consumer Price Index (1.9% per year) still leaves an increase of 3.2% per year in per capita, inflation-adjusted payments for physicians' services. The increase over 15 years, just over 60%, is huge.
Total expenditures are the product of volume of services and average price per service. Fee-for-service (FFS) reimbursement permits relatively straightforward disaggregation of total payments into these price and quantity components. One can then generate a time series of the volume of physicians' services received per capita to show how the quantity and mix of services have changed over time. What is all this extra money buying? How might we reconcile a perceived shortage of doctors with an apparently rapidly increasing supply of medical services? Are these trends in service utilization consistent with the virtually universal perception of a "shortage" of physicians?
Ideally, one would carry out this analysis at the national level. We focus here only on British Columbia because there is no national database that could support the necessary analysis. A national analysis would require a separate study for each province and, while the techniques would be comparable, the availability, consistency and comprehensiveness of the necessary data are not. Even for a single province, the effort required to complete the analysis is considerable. And while every province has its own story, we have no reason to believe that the findings in Canada's third largest province would not be broadly representative of national trends.
In this paper, we report on the disaggregation of payments for FFS physician services in British Columbia over the period 1996/97 to 2005/2006, identifying the contributions of population growth, population aging, changes in fee levels and changes in types and quantities of services provided per capita by both general practitioners (GPs) and specialist physicians. The results open a window onto the apparent physician supply/service paradox.
Methods
Fee-for-service payments to physicians in British Columbia by the province's Medical Services Plan for 1996/97 and 2005/06 were accessed through Population Data BC.1 We removed the effects of fee changes over this period by valuing services provided in both years at the fee levels in effect on April 1, 2005/06. This calculation was actually quite complex because of some significant changes in British Columbia's fee schedule over this period, for example, the creation of different GP office visits fee items for different patient age groups. We chose to use the latter year as the baseline for prices to avoid having to identify what a 2005/06 fee item "would have been" in 1996/97. Where an older fee item did not have a clear 2005/06 counterpart, we used a specialty-specific index provided by the BC Medical Association. This process yielded fee-adjusted or constant-dollar fees.
Data were analyzed at the individual physician and patient level, using unique but study-specific codes that do not permit personal identification of either patients or physicians. Ethics approval for this research was granted by the UBC Behavioural Research Ethics Board.
After removing the effects of fee changes, the analytic framework for this analysis is a simple mathematical identity: where "expenditures" are fee-adjusted.

This relationship permitted us to factor changes in expenditures per capita into changes in several distinct components. These can be re-combined, as well. For example, the middle two components on the right-hand side of the equation can be combined to create a measure of contacts per patient.
We calculated the components of this identity for the population by five-year age group and for five specialty groups: general and family practitioners (GPs/FPs), medical specialists,2 surgical specialists,3 imaging specialists4 and laboratory specialists.5 For presentation purposes, we aggregated the age groups to four categories (0–24, 25–54, 55–74 and 75+) based on similarity of changes over time.
From these calculations, we can identify not only whether increases in utilization per capita are more concentrated among certain age groups – e.g., the elderly – but (at least in broad terms) the classes of physician activities that account for the largest proportion of overall cost growth. We can also determine how practice patterns are changing within these broad groups – are patients seeing more unique physicians or contacting each of those physicians more frequently, and are there changes in the numbers or costliness of services received on each contact? In short, this analytic framework provides a detailed picture of who is receiving what from whom, and how that relationship has changed over time.
Results
The impact of aging
Fee-for-service expenditures in British Columbia grew by almost 40%, or on average 3.8% per year, between 1996/97 and 2005/06 (Table 1). Negotiated fee increases accounted for about a third of this growth (1.2% per year); the volume of services billed thus rose 2.5% annually.6 Demographic factors – population growth and aging – accounted for 1.0% and 0.5%, respectively, leaving a remainder of 1.0% annual growth in age-specific per capita use rates – "intensity of servicing." There is nothing mysterious about the relationship between fee increases and expenditure growth, and demographic trends are what they are; thus, our focus below is on the changing intensity of servicing. These changes increased fee-for-service expenditures per capita by 9.6%, or about $40 over the period studied, adding more than $174 million (in nominal terms) to 2005/06 provincial outlays.
| Table 1. Dynamics of physician fee-for-service expenditures in British Columbia, 1996/97, 2000/01 and 2005/06 | ||||
| 1996/97 | 2005/06 | % Change | ||
| Overall | Average Annual | |||
| Fee-for-service expenditures - Actual (NOMINAL $) | $1,413,528,669 | $1,976,283,823 | 39.8% | 3.8% |
| Growth attributable to fee increases | 1 1.5% | 1.2% | ||
| Fee-for-service expenditures - Adjusted (CONSTANT $) | $1,594,591,397 | $1,998,842,372 | 25.4% | 2.5% |
| BC population | 3,999,383 | 4,388,529 | 9.7% | 1.0% |
| Fee-for-service expenditures per capita (CONSTANT $) | $398.71 | $455.47 | 14.2% | 1.5% |
| Growth attrib. to changes in pop. age structure | 4.3% | 0.5% | ||
| Growth attrib. to changes in FFS age-specific per capita use rates | 9.6% | 1.0% | ||
| BC fee-for-service physicians | 7,281 | 8,617 | 18.3% | 1.9% |
| General / Family practitioners | 4,176 | 4,766 | 14.1% | 1.5% |
| Medical specialists | 1,410 | 1,863 | 32.1% | 3.1% |
| Surgical specialists | 1,302 | 1,553 | 19.3% | 2.0% |
| Imaging specialists | 261 | 286 | 9.6% | 1.0% |
| Laboratory specialists | 132 | 149 | 12.9% | 1.4% |
| BC fee-for-service physicians per 10,000 population | 18.2 | 19.6 | 7.9% | 0.8% |
| General / Family practitioners | 10.4 | 10.9 | 4.0% | 0.4% |
| Medical specialists | 3.5 | 4.2 | 20.4% | 2.1% |
| Surgical specialists | 3.3 | 3.5 | 8.7% | 0.9% |
| Imaging specialists | 0.7 | 0.7 | -0.1% | 0.0% |
| Laboratory specialists | 0.3 | 0.3 | 2.9% | 0.3% |
| Population by age group | 3,999,383 | 4,388,529 | 9.7% | 1.0% |
| 0-24 | 1,292,891 | 1,293,733 | 0.1% | 0.0% |
| 25-54 | 1,841,633 | 1,954,195 | 6.1% | 0.7% |
| 55-74 | 625,366 | 827,577 | 32.3% | 3.2% |
| 75 + | 239,493 | 313,024 | 30.7% | 3.0% |
Overall patterns of use by age and terms of the equation
Table 2 shows the 2005/06 values for each of the components of the analytic framework. Within each column, expenditures per capita by age group and overall are the product of the age-specific (or overall) values for the four right-hand side terms. For example, 81.9% of the population saw at least one physician in 2005/06; each person who made at least one visit saw on average 5.5 physicians two times each and had an average visit cost of $50, yielding overall expenditures per capita of $455 (= 0.819*5.5*2*50, with some allowance for rounding in each of the terms).
| Table 2. 2005/06 values for equation component, specialty and age group | ||||||
| Specialists | ||||||
| GPs / FPs | Med Spec | Surg Spec | Imaging Spec | Lab Spec | All Physicians | |
| Expenditures per Capita | ||||||
| <25 | $107 | $48 | $31 | $13 | $20 | $218 |
| 25-54 | $152 | $65 | $76 | $39 | $54 | $387 |
| 55-74 | $233 | $139 | $179 | $79 | $104 | $734 |
| 75 + | $405 | $196 | $293 | $94 | $138 | $1,127 |
| TOTAL | $172 | $83 | $98 | $43 | $60 | $455 |
| Patients per Population (the "exposure rate") | ||||||
| <25 | 76.5% | 18.5% | 1 1.6% | 14.7% | 26.6% | 78.5% |
| 25-54 | 77.8% | 21.8% | 20.9% | 29.4% | 44.7% | 79.4% |
| 55-74 | 88.0% | 38.4% | 38.0% | 45.6% | 67.7% | 89.5% |
| 75 + | 90.4% | 48.7% | 51.4% | 51.3% | 74.5% | 91.3% |
| TOTAL | 80.2% | 25.9% | 23.6% | 29.7% | 45.8% | 81.9% |
| Physicians per Patient | ||||||
| <25 | 2.5 | 1.5 | 1.5 | 3.9 | ||
| 25-54 | 2.5 | 1.7 | 1.7 | 5.2 | ||
| 55-74 | 2.4 | 2.0 | 1.9 | 7.0 | ||
| 75 + | 3.0 | 2.3 | 2.1 | 9.3 | ||
| TOTAL | 2.5 | 1.8 | 1.8 | 5.5 | ||
| Contacts per Physician | ||||||
| <25 | 1.7 | 1.9 | 1.6 | 1.6 | ||
| 25-54 | 2.4 | 2.1 | 1.8 | 1.9 | ||
| 55-74 | 3.3 | 2.2 | 1.8 | 2.1 | ||
| 75 + | 4.3 | 2.3 | 2.0 | 2.5 | ||
| TOTAL | 2.5 | 2.1 | 1.8 | 1.99 | ||
| Expenditures per Contact | ||||||
| <25 | $32 | $89 | $115 | $58 | $36 | $45 |
| 25-54 | $32 | $84 | $121 | $76 | $42 | $49 |
| 55-74 | $34 | $82 | $137 | $82 | $39 | $55 |
| 75 + | $36 | $76 | $139 | $79 | $31 | $52 |
| TOTAL | $33 | $83 | $129 | $76 | $39 | $50 |
| Contacts per Patient (= physicians per patient × contacts per physician) | ||||||
| <25 | 4.3 | 2.9 | 2.3 | 1.5 | 2.1 | 6.2 |
| 25-54 | 6.0 | 3.5 | 3.0 | 1.8 | 2.9 | 9.9 |
| 55-74 | 7.7 | 4.4 | 3.4 | 2.1 | 3.9 | 15.0 |
| 75 + | 12.6 | 5.3 | 4.1 | 2.3 | 5.9 | 23.7 |
| TOTAL | 6.4 | 3.9 | 3.2 | 1.9 | 3.4 | 11.0 |
| Note: All numbers reflect age-standardization within broad age bands. We used a direct standardization approach, standardizing 1996/97 utilization rates to the 2005/06 population. | ||||||
| Notes for reading the table: Rows are additive only for "expenditures per capita." For the other terms of the equation, the denominators differ by column, which makes it impossible to add the values. The "all physician" column is calculated separately. For example, 80.2% of the overall population saw a GP in 2005/06, 25.9% saw a medical specialist and so on. Overall, 81.9% of the population saw at least one physician, meaning that most people who see specialists also had at least one visit with a GP. Denominators also differ across terms of the equation so, for example, while "patients per population" is a population-based measure, "physicians per patient" is the number of physicians seen for individuals who had at least one visit (i.e., excluding non-users). | ||||||
| Numbers in the grey cells were not calculated because payment data make them impossible to interpret. | ||||||
There is the clear and expected gradient by age in per capita expenditures; there is a five-fold difference in average expenditures per capita comparing the <25 age group and the 75+ age group. More striking is that this gradient applies to every component of the identity, with the exception of average expenditures per contact. The increasing expenditure with age is a result of a greater likelihood of seeing a physician, seeing a greater number of unique physicians and having more contacts with each unique physician.
Changes over time: expenditures per capita
Table 3 shows the changes in components of the identity (in percentage terms) from 1996/97 to 2005/06. As already seen in Table 1, changes in fee-adjusted age-specific expenditures increase overall spending by 9.6%. These changes vary widely across age groups and types of service. Overall, however, we observed a consistent pattern. Without exception, per capita use of every type of service increased more rapidly as one moves up the age distribution, and for every age group, increases were extremely rapid for imaging and laboratory services.
| Table 3. Percentage change by equation component, specialty and age group, 1996/97 to 2005/06 | ||||||
| Specialists | ||||||
| GPs / FPs | Med Spec | Surg Spec | Imaging Spec | Lab Spec | All Physicians | |
| Expenditures per Capita | ||||||
| <25 | -15.6% | 18.8% | -7.9% | 7.2% | 13.1% | -5.1% |
| 25-54 | -5.0% | 10.2% | 2.9% | 23.1% | 34.7% | 5.9% |
| 55-74 | 1.7% | 24.9% | 12.9% | 30.1% | 53.8% | 17.0% |
| 75 + | 4.3% | 29.3% | 15.8% | 59.4% | 64.4% | 20.4% |
| TOTAL | -4.2%% | 19.0% | 7.6% | 28.4% | 42.1% | 9.6% |
| Patients per Population (the "exposure rate") | ||||||
| <25 | -3.4% | 7.8% | -17.4% | 5.2% | 0.5% | -3.5% |
| 25-54 | -1.6% | 1 1.8% | -9.7% | 7.9% | 9.5% | -2.0% |
| 55-74 | 2.4% | 1 1.6% | -1.4% | 10.1% | 17.7% | 1.6% |
| 75 + | 1.1% | 12.6% | -0.4% | 20.3% | 17.3% | 0.2% |
| TOTAL | -1.1% | 11.0% | -7.3% | 9.5% | 10.8% | -1.6% |
| Physicians per Patient | ||||||
| <25 | 0.7% | 3.6% | 1.2% | 4.7% | ||
| 25-54 | 10.8% | 5.7% | 3.6% | 18.8% | ||
| 55-74 | 13.1% | 6.4% | 2.7% | 24.4% | ||
| 75 + | 24.3% | 12.1% | 4.3% | 39.0% | ||
| TOTAL | 9.1% | 6.8% | 3.8% | 19.7% | ||
| Contacts per Physician | ||||||
| <25 | -11.5% | -5.6% | 0.0% | -10.8% | ||
| 25-54 | -8.3% | -10.7% | 0.2% | -10.5% | ||
| 55-74 | -8.8% | -10.8% | -1.7% | -12.1% | ||
| 75 + | -11.5% | -14.5% | 0.4% | -15.0% | ||
| TOTAL | -7.5% | -10.4% | 0.0% | -10.4% | ||
| Expenditures per Contact | ||||||
| <25 | -2.0% | 12.6% | 10.1% | -1.3% | 10.9% | 5.2% |
| 25-54 | -5.0% | 4.4% | 9.7% | 4.5% | 9.9% | 1.7% |
| 55-74 | -3.7% | 17.8% | 13.4% | 5.7% | 1 2.4% | 5.3% |
| 75 + | -6.2% | 19.9% | 11.1% | 10.7% | 5.2% | 1.6% |
| TOTAL | -4.0% | 12.2% | 11.7% | 5.6% | 9.4% | 3.8% |
| Contacts per Patient (= physicians per patient × contacts per physician) | ||||||
| <25 | -10.9% | -2.1% | 1.2% | 3.2% | 1.5% | -6.5% |
| 25-54 | 1.6% | -5.6% | 3.9% | 9.2% | 1 1.9% | 6.3% |
| 55-74 | 3.1% | -5.0% | 0.9% | 1 1.8% | 16.3% | 9.3% |
| 75 + | 10.0% | -4.2% | 4.7% | 19.7% | 33.1% | 18.2% |
| TOTAL | 1.0% | -4.4% | 3.8% | 11.1% | 17.2% | 7.2% |
| Note: All percentage changes are calculated after age-standardization within broad age bands. We used a direct standardization approach, standardizing 1996/97 utilization rates to the 2005/06 population distribution. | ||||||
| Numbers in the grey cells were not calculated because payment data make them impossible to interpret. | ||||||
Overall, per capita use by those over 75 rose by 20.4%; use by those under 25 actually fell by 5.1%, and their use of GP/FP services (fee-adjusted billings) fell by a remarkable 15.6%. And while use of diagnostic services showed double-digit increases in just about every age category, laboratory services for those aged 75+ rose by a spectacular 64.4%, or an average rate of 5.7% per year sustained over nine years. Diagnostic imaging rates for the most elderly rose 59.4% or 5.3% per year. Those over age 75 made up only 7.1% of the population in 2005/06; the somewhat smaller increases in intensity of servicing among the 55–74 age group in laboratory testing (53.8%) and in diagnostic imaging (30.1%) thus had greater financial impact (Table 4). But the pattern across age groups is quite clear: the older the patient, the more rapid the increase in expenditures for diagnostic activity.
| Table 4. Additional fee-adjusted fee-for-service expenditure in 2005/06 by age group and physician specialty group | ||||
| 2005/06 Expenditures per Capita | Per Capita Expenditure Increase - 1996/97 to 2005/06 | Expenditure Change ($ change * pop.) | Group Sum | |
| TOTAL | ||||
| <25 | $218 | -$12 | -$15,324,297 | |
| 25-54 | $387 | $21 | $42,007,999 | |
| 55-74 | $734 | $107 | $88,254,552 | |
| 75 + | $1,127 | $191 | $59,635,217 | $174,573,470 |
| General Practitioners | ||||
| <25 | $107 | -$20 | -$25,672,529 | |
| 25-54 | $152 | -$8 | -$15,811,919 | |
| 55-74 | $233 | $4 | $3,288,793 | |
| 75 + | $405 | $17 | $5,268,585 | -$32,927,071 |
| Medical Specialists | ||||
| <25 | $48 | $8 | $9,719,148 | |
| 25-54 | $65 | $6 | $11,801,130 | |
| 55-74 | $139 | $28 | $22,883,194 | |
| 75 + | $196 | $44 | $13,925,986 | $58,329,458 |
| Surgical Specialists | ||||
| <25 | $31 | -$3 | -$3,462,683 | |
| S25-54 | $76 | $2 | $4,173,394 | |
| 55-74 | $179 | $20 | $16,899,040 | |
| 75 + | $293 | $40 | $12,480,460 | $30,090,210 |
| Imaging Specialists | ||||
| <25 | $13 | $1 | $1,092,522 | |
| 25-54 | $39 | $7 | $14,425,026 | |
| 55-74 | $79 | $18 | $15,059,561 | |
| 75 + | $94 | $35 | $10,981,086 | $41,558,195 |
| Laboratory Specialists | ||||
| <25 | $20 | $2 | $2,999,245 | |
| 25-54 | $54 | $14 | $27,420,368 | |
| 55-74 | $104 | $36 | $30,123,963 | |
| 75 + | $138 | $54 | $16,979,100 | $77,522,677 |
| Note: All dollar figures are calculated after age-standardization within broad age bands. We used a direct standardization approach, standardizing 1996/97 utilization rates to the 2005/06 population distribution. | ||||
Changes over time: contributions of the terms of the equation
Breaking down these overall increases into the underlying changes in patterns of servicing, there was virtually no change (–1.6%) in the proportion of the population contacting at least one fee-reimbursed physician over this period. The increase in number of unique physicians seen was 19.7% overall, but ranged from 4.7% among those under 25 years of age to a much more dramatic 39.0% for those 75+. These increases were partially offset by a decline across all age groups in the number of contacts per physician (–10.4% overall). Combining number of unique physicians and contacts per physician (into "contacts per patient"), we see a reduction of 6.5% in the overall physician contact rate among those under 25, while the rate for those over 75 is up by 18.2%. Average expenditures per contact increased for all age groups, 3.8% overall. Patients are seeing more different doctors, fewer times each, but overall having more physician contacts with increased fee-adjusted billings per contact. And the increases are greatest at the older ages; patients in the youngest age group are actually having fewer contacts with physicians.
Those changes describe overall patterns of use. Looking specifically at GP/FP services, we found small changes in the proportion of the population who have at least one visit, increases in average numbers of physicians seen, reduced numbers of contacts with each physician and reduced expenditure per contact. But a strong age gradient cuts across most of these changes. The proportion of the population who see at least one GP during the year actually fell by 3.4% for the <25 age group while increasing somewhat (2.4% and 1.1%) for the two oldest age groups. The increase in number of unique physicians seen ranges from 0.7% in the <25 group to a 24.3% increase in the 75+ group. The number of contacts per GP seen falls pretty consistently across the board, resulting in a steep age gradient – from a nearly 11% decline to a 10% increase – in the average number of GP contacts per patient.
We find the same overall result for medical and surgical specialists – i.e., the age-specific results mirror, in general, the overall. But here, too, we do find the odd interesting gradient. For example, while fewer people overall (decline of 7.3%) were being referred to surgical specialists, this change was steeply age-graded, with a decline of over 17% in the <25 age group and almost no change in the 75+ group. Patients seen by a medical specialist were, by the end of our period of analysis, seeing more of them – 6.8% more – but for fewer contacts each (down 10.4%) so that, on average, the number of contacts per patient fell by 4.4%. But the increase by 11% in the percentage of the population who had a least one visit and an average increase of 12.2% in expenditures per contact helped to drive overall expenditure increases across all age groups.
Expenditures per contact also increased over this period for surgical specialists, by 11.7%, but for them the contacts per patient were also up (3.8%), not down. The story for the surgical specialties is of a small reduction in the number of patients (per capita) almost exactly offsetting an increase in the different numbers of surgeons that each patient saw, with no change in the number of contacts that a patient had with each physician seen. The increase in expenditures per capita was thus almost entirely driven by the increase in billings per contact, a combination of average procedural costliness creep and more procedures per contact.
The impact of changes on overall expenditures on physician services
These large differences in expenditure increases by age group and specialty do not, of course, translate directly into equivalent differences in expenditures; that depends upon the relative sizes of the population groups and the relative scale of expenditures for the different specialties. As noted above, the 75+ age group has very large percentage increases but they are still a small proportion of the population.
Accordingly, Table 4 disaggregates the changes in actual (fee-adjusted) expenditures by age group and specialty. The dollar figures in this table reflect the amount of expenditure in 2005/06 that would not have been incurred if age-specific use rates from 1996/97 had remained unchanged through 2005/06. As with previous tables, the effects of population growth and population aging have been removed. The increased expenditures for laboratory testing accounted for close to half ($77.5 million) of the overall $174.5 million additional 2005/06 expenditure; in combination with imaging ($41.6 million), "diagnostics" accounted for more than two-thirds of the total increase. Persons 75 years of age and over accounted for 23.5% of this increase in diagnostic procedures ($28.0 million) and just over one-third of the total increase in costs for all types of service ($59.6 million), though they made up only 7% of the population in 2005/06. Persons 55 and over (26% of the population in 2005/06) accounted for more than 60% ($113 millon) of the additional expenditure on laboratory and imaging services and 84.7% ($147.9 million) of the increase in total costs.
These findings represent a remarkable shift in the distribution and nature of physicians' services in British Columbia over a relatively short period of time. Those over 55 were the recipients of most of the increased servicing, and most of the additional expenditures in all age groups went to pay for diagnostic services, primarily laboratory testing.
Discussion
Much of the overall increase of $174 million in (fee-adjusted) physician spending in British Columbia over the period between 1996/97 and 2005/06 was the result of changes in internal system dynamics rather than a response to external population dynamics. The rhetoric of an approaching "grey tsunami" obscures the fact that these increases are occurring on a per capita basis, after adjusting for increases that would be expected simply on the basis of the aging of the population. The bulge of baby boomers starting to turn 65 will (temporarily) increase the impact of aging, but only marginally (Morgan and Cunningham 2011). And the fact remains that there has been a dramatic increase in the intensity of servicing of the elderly, particularly with respect to diagnostic services.
We find – as has every other study of physicians' services use in Canada for the last 30 years – that increases in age-specific utilization had a much larger impact on per capita costs than did aging per se. The analyses here have revealed that the overall age-specific increases are, however, quite variable across patient age and broad physician specialty groups. The findings that stand out are the clear gradient in absolute changes, and rates of increase in service use per capita, with significant increases among those over 75 standing in sharp contrast to the decline for those under 25, the dramatic increases in use of diagnostic services and the general decline in the use of GP/FP services.
There are several limitations to these findings. The first is that over this period physician activities reimbursed by fees for service were a declining share of total payments to BC physicians, as they were across the country (CIHI 2008). Provincial data report an increase of 39.8% in fee-for-service payments, but total payments, including non-FFS sources, increased by 56.0%. In per capita terms the inclusion of non-FFS expenditures raises the increase from 27.4% to 42.2%, or nearly 5% per year. Logically, this increase represents the product of increases in volumes of services and increases in prices. But outside the fee-for-service sector, we do not know the relative sizes of these components, let alone what services were being provided, or to whom.7
While an in-depth analysis of these non-FFS payments will be the subject of a paper still in progress, back-of-the-envelope calculations suggest that taking account of physicians' services reimbursed through non-FFS programs might raise the estimated increase in the average per capita volume of services received by British Columbians by severa1 percentage points, from 14.2% to perhaps 16%–17%, but probably no more than 19%. It seems doubtful, therefore, that the expansion in non-FFS programs would have offset the major trends seen here, in particular the decline in per capita use of GP/FP services.
This projection leads to a second limitation of this, and indeed any, contemporary study based on administrative payment data. Such data are silent on the key question of health impacts. One can count the services provided or the tests performed, but measuring who did what and with which and to whom does not tell us anything about the health consequences. This lack of outcomes information is of particular concern with respect to the rapidly growing laboratory and imaging services, especially those provided to seniors. Did more diagnostic procedures detect new conditions, increase diagnostic accuracy, alter management, keep chronic conditions in check and improve patient outcomes? Or was much of it simply a response to the wider availability of the technology, defensive medicine, "standard practice" or repeat testing associated with seeing many different doctors? Were increased referrals to medical specialists necessary, or the predictable outcome of a poorly organized and overly burdened system of primary care? Unfortunately, we do not currently have data to address these critical questions.
Two further limitations that are in principle readily remediable are, first, this paper's focus only on British Columbia and, second, the somewhat dated nature of the data. But the physician payment and incentive systems and the trends in per capita costs are similar in other provinces, and all have seen a growing role for non-FFS payment methods (CIHI 2008). Accordingly, we believe that the BC experience likely reflects more general pan-Canadian trends. The vagaries of granting cycles and data access requests unavoidably date the analyses. But we do not believe these trends have changed; certainly, both claims of physician scarcity and increases in physician expenditures per capita have continued to the present (CIHI 2009; Francis 2010).
Final Reflections
So, why does it feel like a physician shortage (Chan 2002)? The data presented here suggest an answer. The total volume of services provided rose, but there has been a significant change in the services that are being provided and the patients who are receiving them. Diagnostic services, both laboratory testing and diagnostic imaging, have increased rapidly for all age groups, but especially among the elderly and very elderly. General and family practice services for those under 55, and especially those under 25, have actually fallen substantially, and the decline has not been offset by medical specialists. Three-quarters of the population have experienced, on average, a reduction in services. This might very well be perceived as a "doctor shortage."
The doctors are there, and they are providing (and being paid for) ever-increasing quantities of services. But those ever-increasing quantities are predominantly diagnostic procedures for the elderly rather than "hands-on" care for the general population.8
This change in both the mix of services provided and the patient groups receiving them represents a major redirection of healthcare resources (and money), a shift in medical policy. But this reallocation has not been pursuant to any explicit change in public priorities, or new medical evidence.9 Rather, it has emerged as the aggregate of millions of treatment and referral decisions by literally thousands of individual clinicians.
This population-level shift in aggregate patterns is probably imperceptible on a day-to-day basis to individual physicians or policy makers. Indeed, it may be in part a consequence of the changing demographics of the physician workforce. Younger physicians tend to work fewer hours than the elders they replace (Watson et al. 2004, 2006). Insofar as physicians and their patients age together, this trend could contribute to the observed "twist" in utilization patterns – more care for the elderly, less for the young.
These findings demonstrate, yet again, the fallacy of the "grey tsunami" and the dangerously misleading nature of the corresponding rhetoric. There is a slow "grey glacier" of population aging, but the changes documented here are adjusted for its effects. The additional $174 million in physician expenditures in British Columbia for 2005/06 reflects changes in the ways that the healthcare system is responding to patients.
"To every complex problem there is a simple solution: neat, plausible, and wrong" (H.L. Mencken). Just as the "grey tsunami" rhetoric has served to misdirect public attention away from the changing patterns of care for the elderly, so the "doctor shortage" rhetoric diverts attention from the increasing flow of funds to, and apparent services from, this supposedly scarce supply. The serious questions – what are they all doing, why and with what effect? – are brushed aside.
Diagnostic de la sénescence : contribution à l'augmentation des dépenses pour les médecins en Colombie-Britannique, de 1996-1997 à 2005-2006
Résumé
L'opinion générale soutient que le Canada connaît une pénurie de médecins, cependant les dépenses pour les services des médecins continuent d'augmenter rapidement. Nous nous penchons sur ce paradoxe apparent en analysant les paiements à l'acte remis aux médecins de la Colombie-Britannique, en 1996-1997 et en 2005-2006. Les dépenses par tête en fonction de l'âge (ajustées selon les changements d'honoraires) ont augmenté de 1% par année pendant cette période, ajoutant ainsi 174 millions de dollars aux dépenses pour 2005-2006. Nous avons segmenté ces augmentations selon les changements dans la proportion de la population qui consulte un médecin; le nombre de médecins consultés; le nombre de consultations par médecin; et la dépense moyenne par consultation. Les dépenses pour les services de laboratoire et d'imagerie, particulièrement pour les aînés, ont augmenté de façon spectaculaire. À l'opposé, les services de soins primaires pour les non-aînés semblent avoir décliné. Il est important de porter une attention particulière aux causes, et aux répercussions sur la santé, de ces grands changements.
About the Author(s)
Kimberlyn M. McGrail, MPH, PhD, Assistant Professor and Associate Director, School of Population and Public Health, Centre for Health Services and Policy Research, Vancouver, BC
Robert G. Evans, PhD, Professor Emeritus and Faculty, Department of Economics, Centre for Health Services and Policy Research, Vancouver, BC
Morris L. Barer, MBA, PhD, Professor and Director, School of Population and Public Health, Centre for Health Services and Policy Research, Vancouver, BC
Kerry J. Kerluke, Programmer/Analyst, Centre for Health Services and Policy Research, Vancouver, BC
Rachael McKendry, MA, Research Assistant, Centre for Health Services and Policy Research, Vancouver, BC
Correspondence may be directed to: Kimberlyn M. McGrail, PhD, UBC Centre for Health Services and Policy Research, 201 – 2206 East Mall, Vancouver, BC V6T 1Z3; e-mail: kmcgrail@chspr.ubc.ca.
Acknowledgment
We gratefully acknowledge access to the data which was provided by the BC Ministry of Health through Population Data BC.
References
Canadian Institute for Health Information (CIHI). 2008. Physicians in Canada: The Status of Alternative Payment Programs, 2005–2006. Ottawa: Author.
Canadian Institute for Health Information (CIHI). 2009. National Health Expenditure Trends, 1975 to 2009. Ottawa: Author.
Canadian Press. 2008 (May 5). "New OMA Head Says He'll Focus on Doctor Shortage." Canadian Broadcasting Company. Retrieved July 6, 2011. <http://www.cbc.ca/canada/toronto/story/2008/05/05/oma-president.html>.
Chan, B.T.B. 2002. From Perceived Surplus to Perceived Shortage: What Happened to Canada's Physician Workforce in the 1990s? Ottawa: Canadian Institute for Health Information.
Feasby, T. 2008 (January 30). "Medical Schools are Working Hard to Help Cure the Doctor Shortage." The Globe and Mail. Retrieved July 6, 2011. <http://www.theglobeandmail.com/news/opinions/medical-schools-are-working-hard-to-help-cure-the-doctor-shortage/article663115/>.
Francis, S. 2010 (December 13). "More Power to the Patient." The National Post: A18. Retrieved July 6, 2011. <http://fullcomment.nationalpost.com/2010/12/13/shaun-francis-more-power-to-the-patient/>.
McLaughlin, V. 2005 (August 16). "Family Advertises to Find a Doctor." Pembroke Observer: 1.
Morgan, S.G. and C. Cunningham. 2011. "Population Aging and the Determinants of Healthcare Expenditures: The Case of Hospital, Medical and Pharmaceutical Care in British Columbia, 1996 to 2006." Heathcare Policy 7(1): 68–79.
"No New Medical Practices Leaving People without Doctors – Official." 2006 (February 8). Daily Gleaner: A4.
Tam, P. 2008 (August 7). "Doctor Shortage Continuing; Medical School Enrolment Surge Not Enough, Says CMA Head." Vancouver Sun: A6.
Ubelacker, S. 2008. "Four Million Canadians without Family Doctor." Canadian Press. Retrieved July 6, 2011. <http://www.kpaxpharm.com/stories?docid=1646>.
Watson, D.E., A. Katz, R.J. Reid, B. Bogdanovic, N. Roos and P. Heppner. 2004. "Family Physician Workloads and Access to Care in Winnipeg: 1991 to 2001." Canadian Medical Association Journal 171: 339–42.
Watson, D.E., S. Slade, L. Buske and J. Tepper. 2006. "Intergenerational Differences in Workloads among Primary Care Physicians: A Ten-Year, Population-Based Study." Health Affairs 25(6): 1620–28.
Footnotes
Notes
1 These payments exclude those made to physicians by the Workers' Compensation Board, the federal government, private payments for non-covered services and a small amount of extra billing by private clinics. Provincial government payments to physicians in 2010 are estimated by CIHI to represent 96.8% of total payments (CIHI 2009).
2 Dermatologists, neurologists, psychiatrists, neuropsychiatrists, paediatricians, paediatric cardiologists and specialists in internal medicine, physical medicine, emergency medicine or osteopathy.
3 Obstetricians/gynaecologists, ophthalmologists, otolaryngologists, general surgeons, neurosurgeons, orthopaedic surgeons, plastic surgeons, thoracic and cardiovascular surgeons, urologists and anaesthesiologists.
4 Radiologists and nuclear medicine specialists.
5 Pathologists and medical microbiologists.
6 These percentages do not add precisely because the changes are multiplicative rather than additive.
7 Non-FFS methods of payment do not need to reduce payers' capacity to monitor performance. The devil is in the implementation details, and the BC approaches to implementation have, for the most part, paid insufficient attention to the consequent emasculation of policy and oversight. This is not an irreversible problem. But getting the horse back into the barn will be significantly more difficult than preventing its escape might have been.
8 The data presented here actually understate the extent of the shift towards diagnostic activity, for two reasons. First, diagnostic procedures make up part of the activity of non-diagnostic specialists, and unpublished work by CIHI indicates that this share is increasing. And secondly, in British Columbia medical resonance imaging is reimbursed from regional health authority budgets. The rapid expansion of MRI capacity over this period has substantially increased the proportion of imaging activity and costs that are not captured in the fee-for-service data.
9 Indeed, these trends are directly contrary to public policy pronouncements calling for the importance of, and need to strengthen, primary care.
Comments
Be the first to comment on this!
Personal Subscriber? Sign In
Note: Please enter a display name. Your email address will not be publically displayed