
Healthcare Policy
What Explains Interprovincial Differences in the Uptake of Autonomous NP Primary Care Practice?
Abstract
This paper examines trends in the evolution of the primary care nurse practitioner (NP) workforce in Canada. Specifically, it focuses on two linear regression models. One, unsurprisingly, shows that the number of NPs per capita is positively correlated with the proportion of people declaring having an NP as their regular provider. The second shows that the proportion of patients without a regular provider in a province is very strongly correlated with the proportion of people declaring having an NP as their regular provider. In our view, this analysis supports the hypothesis that NPs are granted more autonomy only when access to care becomes critically constrained.
Introduction
The Canadian Institute for Health Information (CIHI) recently released data on the proportion of Canadians reporting having a regular healthcare provider. The data reveal a notable decline – from 88% in 2019–2021 (CIHI 2023b) to 83% in 2023 (CIHI 2024). The decrease is particularly concerning given the significant federal and provincial investments made during that period to improve accessibility and continuity of care, including efforts to train and retain more healthcare professionals.
In this context, we want to focus on the role of nurse practitioner (NP). NPs are the fastest-growing group of healthcare professionals in Canada (CIHI 2023a). An increased reliance on NPs has also often been put forward as having the potential to trigger a broader transformation of primary care delivery models (Contandriopoulos et al. 2016). In Canada, NPs work within a variety of primary care delivery models. Almost all these models are interprofessional, and most (but not all) include physicians. In this paper, we use the term “autonomous NP practice” to describe models where the NPs' role is defined in a manner that enables them to serve as the main primary care provider for the patients they follow. The article uses linear regression to analyze the interprovincial variations in primary care NP uptake and discusses potential explanations as well as their policy implications.
Data and Methods
This analysis draws on publicly available CIHI data and did not require ethics approval. Data on the number of NPs from 2013 to 2022 were extracted from CIHI's “Health Workforce in Canada, 2022 – Quick Stats” (updated June 2024) (CIHI 2024). Missing data for Manitoba were estimated using linear trends from previous years. Population figures for calculating the ratio of NP per 10,000 people were obtained from the “National Health Expenditure Trends, 2023 Data Tables” (CIHI 2024c). Data on regular healthcare provider access and the professional background of those providers were sourced from CIHI's “Canadians With a Regular Health Provider, 2023 – Data Tables,” (CIHI 2024b), which are derived from Statistics Canada's Canadian Community Health Survey. The analysis only includes provinces and territories for which data were available from all sources, namely, all provinces except Quebec and only Yukon among the territories. Analyses were conducted in Microsoft Excel.
Analysis
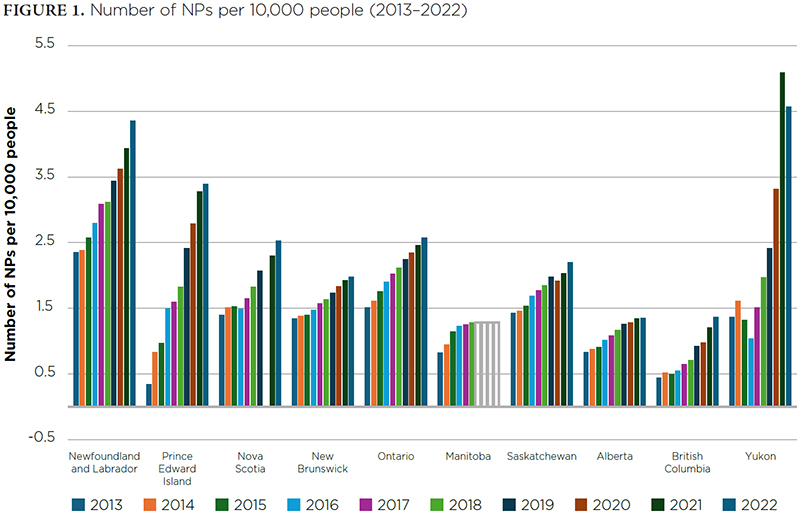
In the jurisdictions analyzed here, the NP workforce grew by over 8% annually (approximately 360 new NPs per year) from 2013 to 2022. As the number of NPs grew at a much faster pace than the population, the number of NPs per capita also grew significantly. The average annual growth rate of the number of NPs per capita was 6.7% and almost perfectly linear (R2 = 0.99).
However, as Figure 1 shows, while all provinces and territories are investing significantly in their NP workforce, the number of NPs per capita and its growth rate vary widely across jurisdictions.

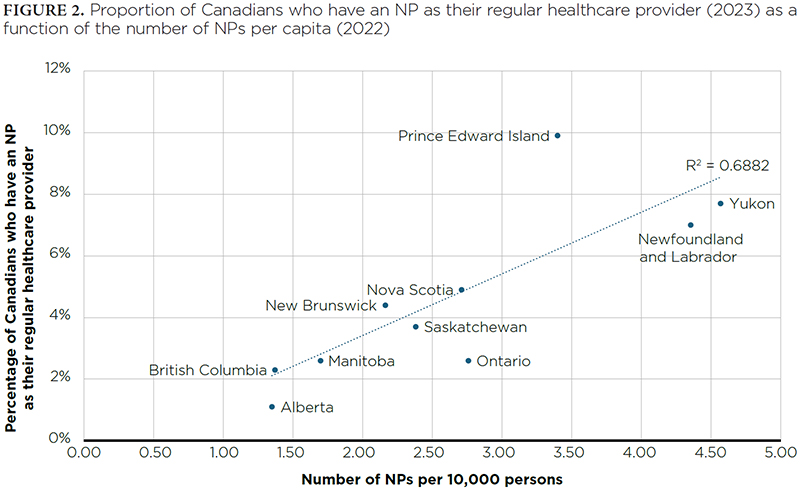
Unsurprisingly, a strong correlation exists between the number of NPs per capita in 2022 and the proportion of residents reporting an NP as their regular healthcare provider in 2023 (R2 = 0.69, p = 0.003; Figure 2). It is also interesting to have a look at the way each jurisdiction is positioned in relation to the regression line in Figure 2. Some provinces manage to have a higher proportion of their population declaring having an NP as their regular healthcare provider than it would have been expected given the size of their NP workforce. In other words, more people are cared for by NPs than one would expect given the number of NPs working in that jurisdiction. Prince Edward Island is the clearest example of such a deviation. Other provinces, such as Alberta and Ontario, are at the other end of the spectrum, having less people declaring having an NP as their regular healthcare provider than what could have been expected given their NP workforce.

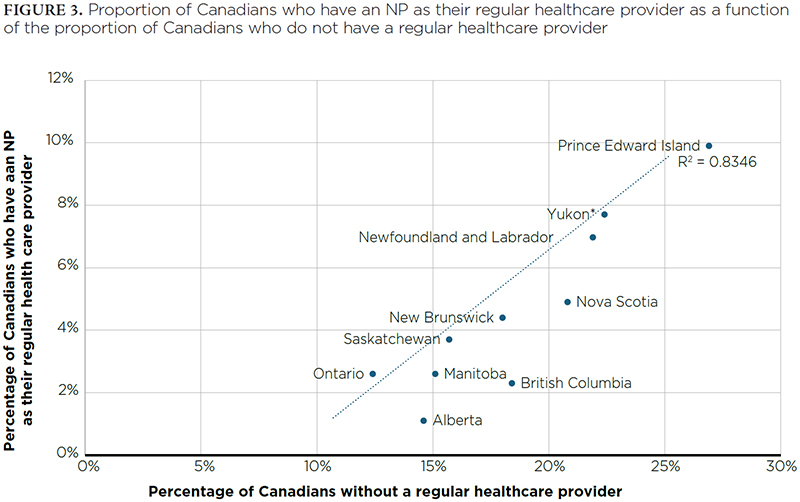
There is also a very strong correlation (R2 = 0.83, p < 0.000) between the proportion of Canadians who declare not having a regular healthcare provider and the proportion declaring to have an NP as their regular healthcare provider (Figure 3). Otherwise said, there is a direct relation between how many people are left without a regular provider and the level of reliance on NPs as regular providers. This relationship becomes even stronger (R2 = 0.96, p < 0.000) if data from the Northwest Territories and Nunavut are included.

Again, it is interesting to analyze how individual jurisdictions are positioned in relation to the regression line. Some provinces, such as British Columbia, rely less on NPs than expected given the number of residents without a primary care provider, while others, such as Ontario, rely more heavily on NPs than predicted.
While regression analyses cannot provide insights on causation, we would like to venture the hypothesis that jurisdictions with the poorest access to primary care are also the most motivated to implement primary care models that support autonomous NP practice. As the number of patients without a regular provider and unmet needs rise, barriers to autonomous NP practice seem to melt away. To be fair, critics might also argue that increased NP reliance reduces accessibility and continuity for all patients – a perspective akin to claiming, for example, that Japan's higher investment in earthquake preparedness somehow causes more seismic activity.
Conclusion and Policy Implications
This analysis has two key policy implications. First, it supports the hypothesis that NPs are granted more autonomy only when access to care becomes critically constrained. In this perspective, more attention should be given to provinces where NP reliance is markedly lower than anticipated. For example, British Columbia, Alberta and Nova Scotia have higher proportions of the population without regular providers, yet the level of reliance on autonomous NP practice is lower than expected in those provinces. Could there be a stronger influence of medical associations in these regions, or are there other factors at play?
Second, we would like to mention that regression coefficients of determinations as high as those found here are quite unusual to encounter in the wild. While we cannot affirm that the number of patients without a regular provider and level of unmet needs really are the explanatory factor behind interprovincial variations in the uptake of autonomous NP practice, we believe that the data make this a robust hypothesis to explore. Ultimately, citizens deserve timely policy action to prevent crises rather than relying on them to drive change.
This leads us to our final point. In an effort to curb the growth of NPs privately billing patients, the federal government recently clarified that the Canada Health Act (1985) applies to primary care services, regardless of the type of professional delivering them (Health Canada 2025). While it remains to be seen how this clarification will influence the dominant model of NP practice, the data analyzed here suggest that empowering NPs to work autonomously holds greater potential than restricting them to support roles.
Correspondence may be directed to Damien Contandriopoulos by e-mail at damien1@uvic.ca.
Qu'est-ce qui explique les différences interprovinciales dans l'adoption de la pratique autonome des IP en soins primaires?
Résumé
Cet article examine les tendances de l'évolution de la main-d'œuvre des infirmières praticiennes (IP) en soins primaires au Canada. Plus précisément, il se penche sur deux modèles de régression linéaire. Le premier montre, sans surprise, que le nombre d'IP par habitant est positivement corrélé à la proportion de personnes déclarant avoir une IP comme fournisseur de soins régulier. Le second montre que la proportion de patients sans fournisseur de soins primaires dans une province est très fortement corrélée à la proportion de personnes déclarant avoir une IP comme fournisseur régulier. À notre avis, cette analyse appuie l'hypothèse selon laquelle les IP obtiennent une plus grande autonomie seulement lorsque l'accès aux soins est sérieusement compromis.
About the Author(s)
Damien Contandriopoulos, Phd, Professor, School of Nursing, University of Victoria, Victoria, BC
Katherine Bertoni, MN, NP-F, CDE, Phd(C), Associate Teaching Professor, School of Nursing, University of Victoria, Victoria, BC
References
Canada Health Act (R.S.C., 1985, c. C-6). Government of Canada. Retrieved April 25, 2025. <https://laws-lois.justice.gc.ca/eng/acts/c-6/>
Canadian Institute for Health Information (CIHI). 2023a. Health Workforce in Canada, 2023 – Quick Stats. Retrieved April 25, 2025. <https://www.cihi.ca/en/taking-the-pulse-a-snapshot-of-canadian-health-care-2023>[A1].
Canadian Institute for Health Information (CIHI). 2023b. Taking the Pulse: A Snapshot of Canadian Health Care, 2023. Retrieved April 25, 2025. <https://www.cihi.ca/en/taking-the-pulse-a-snapshot-of-canadian-health-care-2023>.
Canadian Institute for Health Information (CIHI). 2024. Health Workforce in Canada, 2022 — Quick Stats (Updated June 2024). Ottawa: Canadian Institute for Health Information. Retrieved April 25, 2025. <https://www.cihi.ca/sites/default/files/document/health-workforce-quickstats-2022-data-tables-en.xlsx>.
Canadian Institute for Health Information (CIHI). 2024a. Taking the Pulse: Measuring Shared Priorities for Canadian Health Care, 2024. Retrieved April 25, 2025. <https://www.cihi.ca/en/taking-the-pulse-a-snapshot-of-canadian-health-care-2023>.
Canadian Institute for Health Information (CIHI). 2024b. Canadians With a Regular Health Provider, 2023 – Data Tables. Ottawa: Canadian Institute for Health Information. Retrieved April 25, 2025. <https://www.cihi.ca/sites/default/files/document/canadians-with-regular-health-provider-data-tables-en.xlsx>.
Canadian Institute for Health Information (CIHI). 2024c. National Health Expenditure Trends – Data Tables. Retrieved April 25, 2025. <https://www.cihi.ca/sites/default/files/document/nhex-2024-full-data-tables-en.zip>.
Contandriopoulos, D., A. Brousselle, M. Breton, E. Sangster-Gormley, K. Kilpatrick, C.A. Dubois et al. 2016. Nurse Practitioners, Canaries in the Mine of Primary Care Reform. Health Policy 120(6): 682–89. doi:10.1016/j.healthpol.2016.03.015.
Health Canada. 2025, January 10. Statement From the Minister of Health on the Canada Health Act. Retrieved April 25, 2025. <https://www.canada.ca/en/health-canada/news/2025/01/statement-from-the-minister-of-health-on-the-canada-health-act.html>.
Comments
Be the first to comment on this!
Personal Subscriber? Sign In
Related Articles

Note: Please enter a display name. Your email address will not be publically displayed