


Healthcare Quarterly
Rethinking Environmentally Sustainable Chronic Care: A Canadian Case Study of Funded Small House Models
Abstract
Canada's healthcare system faces increasing strain as patients who could be managed in alternative levels of care (ALCs) occupy acute hospital beds. The small house model (SHM) offers an opportunity to alleviate the growing burden on hospitals and long-term care facilities while supporting environmentally sustainable care. This case study quantifies the greenhouse gas (GHG) footprint of two facilities in Hamilton, Ontario. Annual emissions were 1,612 kg CO2e/bed and 512 kg CO2e/bed, respectively, with travel contributing significantly to emissions. Our study provides a baseline GHG footprint of the SHM, allowing for comparison to traditional methods of ALC.
Introduction
The Canadian healthcare system has become increasingly burdened, facing hospital staffing shortages, fewer available hospital beds and increasingly longer emergency hospital wait times (Varner 2023). All too often, patients who could be better served in an alternative level of care (ALC) occupy a hospital bed without requiring the resources of a hospital. These patients occupy valuable hospital resources while waiting to receive care in settings such as long-term care (LTC) homes or at home, supported by home care. The Canadian Institute for Health Information (CIHI) reports that 6.2% of hospital admissions resulted in ALC days spent in hospital that might otherwise be avoided (CIHI 2025). However, in 2023, wait times for LTC in Canada were as high as 72 days for patients transferring from the hospital and 201 days for patients transferring from the community (Ontario Health 2025). In addition to occupying valuable resources, additional days in the hospital can have substantial environmental impacts. A life cycle analysis study identified that the Canadian healthcare system produced 4.6% of the national total carbon emissions, a quantity nearly equivalent to the air transportation industry (Eckelman et al. 2018). Hospitals alone contribute to 3.1% of Canada's entire greenhouse gas (GHG) output, a quantity nearly equivalent to the contribution from the manufacturing of primary metals (Eckelman et al. 2018). LTC also carries a significant environmental burden, with a single bed day for one patient producing a significant 8.7 kg CO2e (Sergeant et al. 2024).
One promising yet underutilized approach to alleviate the burden on hospitals and LTC facilities is the use of small home models, commonly called residential care, referred to herein as the small house model (SHM). We define SHMs as small healthcare facilities that operate out of retrofitted homes or home-sized buildings that accommodate 6–20 residents (Longstaff et al. 2022). SHMs involve all levels of staff in the decision-making process and aim to provide a home-like personalized environment, aimed at maximizing quality of life, featuring decentralized dining, accessible outdoor areas and staff workstations integrated in the household living space (Longstaff et al. 2022). In contrast, traditional LTC homes typically follow an institutional, medical model with 20 or more residents, top-down decision-making, centralized staff stations and less resident autonomy (Longstaff et al. 2022). A recent literature review highlights SHMs' emphasis on resident autonomy as a defining philosophical difference (Longstaff et al. 2022). Given Canada's aging population, residential care facilities are poised to play a significant role in the Canadian healthcare system over the coming years.
While SHMs offer clear advantages for patient-centred care and system efficiency, it is equally important to consider their environmental footprint, as healthcare settings can be highly resource- and energy-intensive. Thus, as the potential for new care models to alleviate strain on the healthcare system is explored by policy makers, their impact on planetary health must be evaluated. The connection between the environment and health is well studied: rising carbon emissions and poor air quality contribute to higher rates of chronic and cardiopulmonary disease and exacerbation of existing symptoms, while shifts in climate and temperature alter patterns of vector borne diseases (Bouchard et al. 2019; Cosselman et al. 2015; Demers and Gosselin 2019; Dockery et al. 1993; Ludwig et al. 2019; Meo et al. 2015; Ng et al. 2019; Thurston and Lippmann 2015; WHO 2025). The overall contribution of our healthcare system to climate change is not insignificant.
While the carbon footprint of hospitals and larger ALC options, such as LTC, has been examined, the carbon footprint of smaller care settings, such as SHMs, has not. We previously directly compared the carbon emissions of hospitals, LTC settings and home care, finding that one hospital bed day contributed 30.3 kg CO2e compared to 8.7 kg CO2e for LTC and just 1.3 kg CO2e for home care (Sergeant et al. 2024). Thus, SHMs have the potential to provide better patient care through higher provider:patient ratios, at a lower carbon footprint. Understanding the GHG impact of SHMs is important not only for informing healthcare infrastructure decisions, but it also assists in developing a broader understanding of sustainable healthcare delivery in Canada. This study presents two case studies of SHMs operating from previously retrofitted residential homes. To complement these case studies, we use national energy use data and modelling to illustrate the scale of potential impact.
Methodology
Population and sample size
For the purposes of this study, an SHM was defined as a healthcare facility licensed as an SHM by the city of Hamilton. Valid SHMs included psychiatric, developmental disability, geriatric and chronic care homes. An initial pool of 55 SHMs was assessed for eligibility, and 36 eligible SHMs located in Hamilton, Ontario, Canada, were identified through a public listing and contacted. Of the 36 facilities contacted, seven agreed to participate in the study. Of the seven participating facilities, only two facilities completed the study and provided a full dataset (see Appendix 1 here for further study enrolment details).
Data collection
Facility-level data were collected from recruited SHMs, including utility bills for natural gas, water and electricity usage. This study also collected employee transportation data using an online survey. The online survey collected the following data: the number of trips made by employees to SHMs, the distance of travel for an employee commuting to work and the type of transportation used by employees. Winter travel data were collected separately to investigate potential differences in travel behaviour over the winter months, which were defined as November to March for this study. Respondents were asked to consider the time period from November 1, 2023, to October 31, 2024, for assessment.
Data analysis
Aggregate building carbon emissions associated with the facilities' natural gas, electricity and water usage were calculated. Emission conversion factors for Ontario, obtained from Statistics Canada, were used to estimate the carbon emissions associated with gas and electricity usage. An emission factor of 38 g CO2e/kWh was applied for electricity, and 1,921 g CO2e/m³ was used for natural gas (Environment and Climate Change Canada 2025). Given the lack of available data on the carbon emissions associated with water usage in Hamilton, a research study from the neighbouring Region of Waterloo, located 70 km away, was used. This study estimated that 1 m3 of water usage is associated with 0.625 kWh of electricity consumption (Sustainable Waterloo Region 2013). This value was used in combination with Ontario's electricity grid emission factor, as previously described, to calculate the carbon emissions associated with water usage. For each facility, a sum of gas-, electricity- and water-associated carbon emissions was calculated.
Carbon emissions associated with employee transport were also calculated. The carbon emission factors in kg CO2e for different modes of transport range from 0 for walking and cycling to 0.1974 for a gas-powered car, with electric cars (0.0647) and buses (0.097) having intermediate values (Department for Energy Security and Net Zero and Department for Business, Energy & Industrial Strategy 2022; Plug'n Drive 2015). For each facility, a sum of total travel emissions was calculated. A sum of travel and building emissions was calculated for each facility over the time period of 12 months. Total carbon emissions per facility were standardized by the number of patient beds.
Ethics
This study was approved by the Hamilton Integrated Research Ethics Board (Project #17529). The survey was accompanied by an introductory statement outlining the purpose of the study, the voluntary nature of participation and assurances of confidentiality. By proceeding to complete and submit the survey, participants provided implied consent. To ensure our survey remained anonymous, no identifying information, such as names, addresses or otherwise, was collected. Received data were grouped per facility and are presented in aggregate. Additionally, data from facilities were anonymized using artificial labels to maintain the confidentiality of facilities.
Results
Site characteristics
This study presents a case study of two facilities, facility A and B. Facility A is a larger SHM site with 20 residents and 12 staff. Facility B is a smaller SHM home accommodating six residents and employing six staff. Facility A was constructed 116 years ago, whereas facility B was built 71 years ago. Together, these two facilities illustrate the energy use of SHMs across different scales of operation. The following results characterize their GHG emissions.
Commute distances
Facility A employees traveled considerably farther, with a median daily commute of 6.1 km, a wide interquartile range (IQR) and a maximum of 78.7 km traveled. In contrast, employees at facility B had a median daily commute of 1.2 km and a narrower range of distances traveled with an IQR ranging from 0.6 to 3.1 km.
Carbon emissions by facility
Figure 1 illustrates the carbon emissions per bed for facilities A and facility B. Facility A demonstrates higher annual total carbon emissions (1,914 kg CO2e/bed or 5.24 CO2e/bed day) compared to facility B (670 kg CO2e/bed or 1.84 CO2e/bed day).
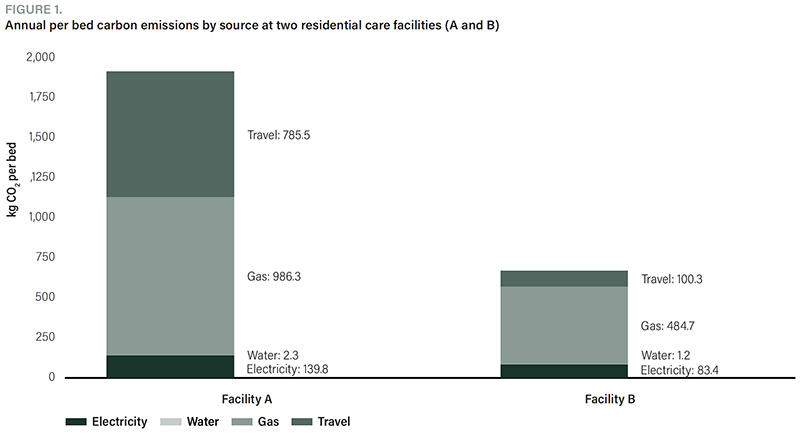
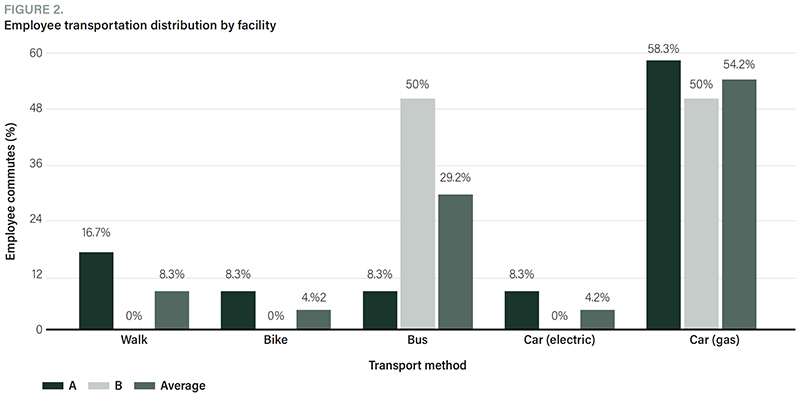
Natural gas was the largest contributor among building emissions for both sites, followed by electricity. Comparatively, water consumption had a negligible impact on carbon emissions. Travel emissions formed a sizable contribution to carbon emissions at both sites, comprising 41% of facility A's and 15% of facility B's total emissions. The disparity in the contribution of travel to carbon emissions is consistent with the considerably longer commute distances reported by employees at facility A, as shown in Figure 2.
Employee transport methods
Figure 2 displays the methods of transportation used by employees at both facilities. There was no difference in employees' transportation preferences between winter and non-winter months. The number of respondents was 12 and six employees, respectively, from sites A and B. Employees at both sites largely commute by gasoline-powered cars, with more than half of employees at each site using gasoline-powered cars. While facility B had a larger percentage of employees travel by bus (50%), a sizable portion of employees at facility A also traveled by bus (29.2%). In contrast to facility A, there was no use of walking, cycling or electric cars by employees at facility B.
National ALC scenario
Yearly, there are approximately 3,236,053 bed days spent waiting for ALC in hospitals across Canada (CIHI 2025). Wait times for LTC average 72 days from hospital settings (CIHI 2025; Ontario Health 2025). If a segment of patients is cared for in SHMs, this would allow for significant carbon savings. To illustrate, if 40% of current hospital ALC days were shifted to SHMs and 20% to LTC, emissions would be nearly halved compared to the current status quo (Table 1). While precise estimates depend on the assumptions applied and further studies to better understand the GHG impact of the SHM are needed, these scenarios and our studied facilities demonstrate the possible benefits SHMs and similar models could have on meaningful system-wide carbon reductions and hospital capacity pressures.
| TABLE 1. Estimated GHG emissions under different scenarios for distribution of Canadian ALC bed days (3,236,053) across different settings, assuming a mix of hospital-, LTC- and SHM-based care (CIHI 2025) | |||||
| Scenario | Hospital (%) | LTC (%) | SHM (%) | Estimated GHGs (million kg CO2e) | Relative reduction vs. 100% hospital |
| Baseline | 100 | 0 | 0 | 98.0 | |
| Mixed | 40 | 20 | 40 | 49.4 | ~50% |
| Ideal | 0 | 40 | 60 | 18.1 | ~82% |
| ALC = alternative level of care; GHG = greenhouse gas; LTC = long-term care; SHM = small house model. | |||||
Emissions per bed day are based on previously published data (hospital: 30.3 kg CO2e, LTC 8.7 kg CO2e) and the case studies presented in this paper (average SHM: 3.54 kg CO2e) (Sergeant et al. 2024).
Discussion
Summary of findings
This case study of two SHM facilities demonstrates the impact of scale and staff commuting on the carbon footprint of residential care. Facility B, the smaller site, produced substantially lower per-bed emissions (670 kg CO2e/bed) compared to facility A (1,914 kg CO2e/bed), consistent with its smaller staff size, younger building age and shorter commuting distances. Across both facilities, building emissions were primarily driven by natural gas, with electricity contributing moderately and water use minimally. This highlights that energy efficiency and fuel source substitution are a major area to target for improvement. The predominance of gasoline-powered vehicles in commuting patterns presents another area for targeted intervention. In a broader health system context, scenario modelling suggests that shifting ALC days from hospitals into SHM settings could both alleviate hospital capacity pressures and achieve significant GHG reductions, approaching 50% under a mixed care model and 82% under ideal conditions. Together, these findings indicate that SHMs hold considerable promise as a care model capable of advancing health system sustainability and climate goals simultaneously.
Environmental impact
A previous study comparing facilities with ALC patients awaiting discharge found that hospitals produce 30.3 kg CO2e/bed day, compared to 8.7 kg CO2e/bed day in LTC and 1.3 kg CO2e/bed day in home care (Sergeant et al. 2024). In this present study, the SHMs produced on average 3.54 kg CO2e/bed day, a quantity lower than reported for LTC (Table 2). These results provide data to support that SHMs could be an intermediate option, with a carbon footprint that falls between LTC and home care, while maintaining a footprint substantially lower than hospital-based ALC, and providing a high quality of life for residents. It is important to note that the comparison data are drawn from the province of British Columbia, where the electricity grid emits 15 g CO2e/kWh, compared to 38 g CO2e/kWh in Ontario (Environment and Climate Change Canada 2025). Nevertheless, a large portion of carbon emissions identified in this study came from natural gas, a major producer of CO2. The use of electric heat pumps has the potential to reduce carbon emissions, insofar as the underlying electricity grid can support them. Ontario's power grid is largely sourced from renewable energy and, as discussed, emits only 38 g CO2e/kWh (Environment and Climate Change Canada 2025). Moreover, Natural Resources Canada suggests the energy efficiency of electric heating systems to be 190% for heat pumps in comparison to 62–90% for natural gas-based systems (Natural Resources Canada 2023). Additionally, in the studied SHMs, a large portion of travel-related emissions was attributable to single-person motorized transport, even where travel distance was minimal. Encouragement of active transport, carpooling or optimizing staff scheduling to reduce commute burden can further reduce travel-related emissions.
| TABLE 2. Comparison of LTC homes and SHMs* | |||||
| Model | Traditional model | Small house model | |||
| Number of residents | ≥20 | 6–20 | |||
| Care model | Institutional or operational | Person-centred | |||
| Philosophy of care | Medical model | Quality of life | |||
| Decision-making model | Top-down | Flattened hierarchy | |||
| Patient cost per patient per day | Varies† | Varies† | |||
| GHGs per bed day | 8.7 kg | 3.54 kg | |||
| GHG = greenhouse gas; LTC = long-term care; SHM = small house model. | |||||
| † The patient cost at facilities varies in the literature; all examined studies identify that SHMs have a nearly equivalent or lower cost compared to LTC homes (Cohen et al. 2016; Cristobal 2016; Grabowski et al. 2016). | |||||
| * Adapted from the CADTH Health Technology Review (Longstaff et al. 2022) | |||||
Scaling implications and national impact
When considering alternatives to hospitals or LTC facilities, it is important to recognize the inherent carbon costs of large institutions. Hospitals and LTC homes require dedicated new construction, and once built, their large surface areas impose high baseline energy demands for heating, cooling, lighting and maintenance. In contrast, SHMs can often repurpose existing homes, avoiding the emissions related to new construction and heating large surface areas. Furthermore, these case studies suggest that SHMs remain relatively energy-efficient per resident even when scaled to a larger size.
Household energy scaling
Independent national data suggest that the increase in energy per household occupant declines as occupancy rises. For example, the latest 2020 U.S. Residential Energy Consumption Survey demonstrates that for small residential buildings, energy demand rises by 24.8 GJ when going from one to two occupants but only 4.4 GJ from two to three, and between 7 and 11 GJ for each occupant after that (U.S. EIA 2020). The latest available Canadian data regarding energy increase per occupant are from 2011 and are outdated but demonstrated a similar trend (Statistics Canada 2015). This supports the finding that SHMs are relatively energy-efficient per resident. Once household infrastructure is in place, many of the large energy costs of the building are shared, including heating, lighting and appliances, thereby allowing for a lower per person carbon footprint.
Equity, funding and system-level potential
SHMs that operate out of retrofitted residential buildings offer many potential advantages including quicker construction, personalized care, increased patient autonomy and reduced logistical and financial barriers compared to establishing large-scale LTC facilities (Longstaff et al. 2022). The findings of this study further support SHMs as an ALC option with a low carbon footprint, with lower operational and travel emissions. Since many SHMs are retrofitted residential buildings, the overall lifecycle emissions of an SHM may be even lower than those identified in this study in contrast to LTC homes, as the SHMs could have increased energy efficiencies (e.g., heat pumps, high efficiency appliances) that were not present in the facilities included in this study. There is a further possibility that the conversion of residential homes into SHMs could increase the number of housing occupants per home, which may lower per-person energy use and help address pressures from the housing crisis, particularly in the context of Canada's aging population.
A large barrier for the widespread integration of SHMs is funding. There is a disparity in the quality of care provided across SHMs, which may relate to the level of funding and lack of regulation (Longstaff et al. 2022). This phenomenon, however, is not unique to SHMs. Larger LTC homes and other areas in the chronic care sector at large that lacked appropriate funding during the COVID-19 pandemic faced similar issues. The Ontario LTC commission's final report reflecting on the pandemic outlined that the pandemic brought to light issues, including staffing shortages, lack of funding, outdated infrastructure and administrative challenges (Ministry of Long-Term Care 2022). When appropriately funded, SHMs are capable of providing high-quality care with a number of potential advantages. SHMs are currently largely privately funded, but appropriate public investment may establish them as viable tools for addressing Canada's growing demand for community chronic care (Longstaff et al. 2022).
Given SHMs are established in residential buildings, there is an opportunity to select locations to best serve the needs of a specific community, allowing for culturally sensitive and tailored care for individual communities. Many SHMs can be established in this fashion across different communities in walkable and easily visitable distances for families. However, administrative hurdles, construction time and building zone restrictions make this less feasible for larger LTC homes. SHMs established in communities may allow for shorter commute times for workers and employees who may also live in the same area.
It is well established that drastic changes to the home environment can be detrimental for those with dementia and may be a risk factor for precipitating delirium in sick elderly patients (Ramírez Echeverría et al. 2025; Soilemezi et al. 2017). Given that SHMs are situated in a familiar home-like environment, they contain features that may allow for personalized care and an easier transition for the patients (Longstaff et al. 2022). SHMs are a potentially more compassionate care alternative to more medical settings, which could lead to improved quality of life for patients and their families.
Next steps and limitations
This study presents an in-depth analysis of two SHM facilities, selected from an initial pool of seven out of 55 contacted in Hamilton, Ontario. While these cases provide detailed insights into operational and travel-related GHG emissions, the small sample size limits the generalizability of our findings across Canada. Rather than providing definitive national estimates, these two case studies serve as illustrative examples of how SHMs compare to hospitals and LTC homes from an energy and emissions perspective. Furthermore, the scope of this discussion is necessarily constrained by the small body of available literature and research on the SHM model. Future research should expand on this work and examine a larger and more geographically diverse set of facilities to refine GHG estimates, explore lifecycle emissions and assess interventions to further reduce environmental impacts. Importantly, our study serves as a methodological framework that can guide broader sustainability analyses of SHMs and other residential care settings.
Conclusion
The two studied SHMs show a carbon footprint lower than that of LTC homes. Beyond environmental benefits, when appropriately funded, SHMs offer many other benefits including personalized high-quality care, quicker construction, equitable access to care, culturally sensitive and community-specific care and a home-like environment that may be particularly beneficial for patients with cognitive decline (Longstaff et al. 2022). We propose that the SHM is a promising model that may be used as a component of a broader sustainable and equitable healthcare strategy to help address the growing demands of chronic care in Canada's aging population (Table 3). Importantly, this study provides a methodological framework that can guide future research and support sustainable care planning. It offers an approach to quantifying operational and travel-related GHG impacts in SHMs and other residential care models.
| TABLE 3. Suggested focus areas for leadership and potential impact | ||
| Focus area | Suggestion | Expected impact |
| Funding and policy | Secure stable funding and regulatory support | Enables high-quality, equitable care |
| Energy efficiency | Retrofit SHMs with efficient heating/cooling | Reduces GHG emissions |
| Staff and commute | Promote local hiring, active transport and carpooling | Lowers travel-related emissions |
| Monitoring and research | Track emissions and share best practices | Guides future sustainable care planning |
| GHG = greenhouse gas; SHM = small house model. | ||
About the Author(s)
Danish Zahid, BMSc, is a medical student at McMaster University, Hamilton, ON, with a Bachelor of Medical Sciences degree from Western University, London, ON. Danish Zahid is committed to integrating sustainability into the healthcare field.
Russell J. de Souza, ScD, RD, is a registered dietitian and nutritional epidemiologist at the Department of Health Research Methods, McMaster University, Hamilton, ON. Russell J. de Souza is working to advance health equity through evidence-based research and culturally tailored interventions.
Myles Sergeant, MD, PEng, CCFP, FCFP, is a family physician at the Department of Family Medicine, McMaster University, Hamilton, ON; executive director at the Canadian Coalition for Green Health Care, Canada; and co-lead at PEACH Health Ontario, Hamilton, ON. Myles Sergeant can be reached by e-mail at sergeam@mcmaster.ca.
Acknowledgment
We are grateful to the Small House Model Facilities who spoke with us and had valuable discussions regarding the issues examined in this study. Special thanks are extended to the two facilities that provided data for this study. Thank you to Fiona Parascandalo, Research Coordinator with PEACH Health Ontario within the Department of Family Medicine at McMaster University, for her assistance in the final edit of the article.
References
Bouchard, C., A. Dibernardo, J. Koffi, H. Wood, P. Leighton and L. Lindsay. 2019. Increased Risk of Tick-Borne Diseases With Climate and Environmental Changes. Canada Communicable Disease Report 45(4): 81–89. doi:10.14745/ccdr.v45i04a02.
Canadian Institute for Health Information (CIHI). 2025. Hospital Stays in Canada, 2023–2024. Retrieved October 13, 2025. <https://www.cihi.ca/en/hospital-stays-in-canada-2023-2024>.
Cohen, L.W., S. Zimmerman, D. Reed, P. Brown, B.J. Bowers, K. Nolet et al. 2016. The Green House Model of Nursing Home Care in Design and Implementation. Health Services Research 51(Suppl 1): 352–77. doi:10.1111/1475-6773.12418.
Cosselman, K.E., A. Navas-Acien and J.D. Kaufman. 2015. Environmental Factors in Cardiovascular Disease. Nature Reviews Cardiology 12(11): 627–42. doi:10.1038/nrcardio.2015.152.
Cristobal, L.A. 2016. Application of the Green House Model to the U.S. Geriatric Veteran Population. Yale School of Nursing Digital Theses. Retrieved Oct 13, 2025. <https://elischolar.library.yale.edu/ysndt/1027>.
Demers, I. and P. Gosselin. 2019. At-a-Glance – Pollens, Climate and Allergies: Quebec Initiatives. Health Promotion and Chronic Disease Prevention in Canada 39(4): 136–41. doi:10.24095/hpcdp.39.4.05.
Department for Energy Security and Net Zero and Department for Business, Energy & Industrial Strategy. 2022, September 20. Greenhouse Gas Reporting: Conversion Factors 2022. Retrieved December 25, 2025. <https://www.gov.uk/government/publications/greenhouse-gas-reporting-conversion-factors-2022>.
Dockery, D.W., C.A. Pope, X. Xu, J.D. Spengler, J.H. Ware, M.E. Fay et al. 1993. An Association Between Air Pollution and Mortality in Six U.S. Cities. New England Journal of Medicine 329(24): 1753–59. doi:10.1056/NEJM199312093292401.
Eckelman, M.J., J.D. Sherman and A.J. MacNeill. 2018. Life Cycle Environmental Emissions and Health Damages From the Canadian Healthcare System: An Economic-Environmental-Epidemiological Analysis. PLoS Medicine 15(7): e1002623. doi:10.1371/journal.pmed.1002623.
Environment and Climate Change Canada. 2025, October. Emission Factors and Reference Values. Retrieved December 25, 2025. <https://www.canada.ca/en/environment-climate-change/services/climate-change/pricing-pollution-how-it-will-work/output-based-pricing-system/federal-greenhouse-gas-offset-system/emission-factors-reference-values.html>.
Grabowski, D.C., C.C. Afendulis, D.J. Caudry, A.J. O'Malley, P. Kemper and THRIVE Research Collaborative. 2016. The Impact of Green House Adoption on Medicare Spending and Utilization. Health Services Research 51(Suppl 1): 433–53. doi:10.1111/1475-6773.12438.
Longstaff, W., J. Filowski and M. Severn. 2022. The Small House Model to Support Older Adults in Long-Term Care: CADTH Health Technology Review. Canadian Agency for Drugs and Technologies in Health. Retrieved August 25, 2025. <http://www.ncbi.nlm.nih.gov/books/NBK595360/>.
Ludwig, A., H. Zheng, L. Vrbova, M.A. Drebot, M. Iranpour and L.R. Lindsay. 2019. Increased Risk of Endemic Mosquito-Borne Diseases in Canada Due to Climate Change. Canada Communicable Disease Report 45(4): 91–97. doi:10.14745/ccdr.v45i04a03.
Meo, S.A., A.N. Memon, S.A. Sheikh, F.A. Rouq, A.M. Usmani, A. Hassan et al. 2015. Effect of Environmental Air Pollution on Type 2 Diabetes Mellitus. European Review for Medical and Pharmacological Sciences 19(1): 123–28.
Ministry of Long-Term Care. 2022. Long-Term Care COVID-19 Commission: Final Report and Progress on Interim Recommendations. Government of Ontario. Retrieved December 25, 2025. < https://wayback.archive-it.org/16312/20220224044814/https://www.ontario.ca/page/long-term-care-covid-19-commission-progress-interim-recommendations>.
Natural Resources Canada. 2023, April 25. Residential Sector Canada Table 32: Heating System Stock Efficiencies. Government of Canada. Retrieved August 24, 2025. <https://oee.nrcan.gc.ca/corporate/statistics/neud/dpa/showTable.cfm?type=CP§or=res&juris=ca&year=2020&rn=32&page=0#footnotes>.
Ng, V., E.E. Rees, L.R. Lindsay, M.A. Drebot, T. Brownstone, T. Sadeghieh et al. 2019. Could Exotic Mosquito-Borne Diseases Emerge in Canada With Climate Change? Canada Communicable Disease Report 45(4): 98–107. doi:10.14745/ccdr.v45i04a04.
Ontario Health. 2025. Long-Term Care Home Wait Times in Ontario – Health Quality Ontario (HQO). Retrieved September 28, 2025. <https://www.hqontario.ca/system-performance/Long-Term-Care-Home-Performance/Wait-Times>.
Plug'n Drive. 2015. Electric Vehicles: Reducing Ontario's Greenhouse Gas Emissions. Retrieved December 25, 2025. <https://www.plugndrive.ca/wp-content/uploads/2017/07/Electric-Vehicles-Reducing-Ontarios-Greenhouse-Gas-Emissions-A-Plugn-Drive-Report.pdf?srsltid=AfmBOopZNiakvqZF7pkZCPeT-Tg9j3j6yHvdpxoOQ1fsrh1kU-uCndHD>.
Ramírez Echeverría, M.L. and C. Schoo. 2025. Delirium. In StatPearls. StatPearls Publishing. Retrieved September 28, 2025. <http://www.ncbi.nlm.nih.gov/books/NBK470399/>.
Sergeant, M., O. Ly, S. Kandasamy, S.S. Anand and R.J. de Souza. 2024. Managing Greenhouse Gas Emissions in the Terminal Year of Life in an Overwhelmed Health System: A Paradigm Shift for People and Our Planet. The Lancet Planetary Health 8(5): e327–33. doi:10.1016/S2542-5196(24)00048-2.
Soilemezi, D., A. Drahota, J. Crossland and R. Stores. 2017. The Role of the Home Environment in Dementia Care and Support: Systematic Review of Qualitative Research – Dia Soilemezi, Amy Drahota, John Crossland, Rebecca Stores, 2019. Retrieved September 28, 2025. <https://pubmed.ncbi.nlm.nih.gov/29149787/>.
Statistics Canada. 2015. Households and the Environment: Energy Use: Table 4-1 – Average Household Energy Use, by Household and Dwelling Characteristics, 2011 – Household Size. Government of Canada. Retrieved September 13, 2025. <https://www150.statcan.gc.ca/n1/pub/11-526-s/2013002/t005-eng.htm>.
Sustainable Waterloo Region. 2013. Calculating Emissions From Water Use and Collection in Waterloo Region. Retrieved September 13, 2025. <https://www.sustainablewaterlooregion.ca/wp-content/uploads/2013/12/Water-Emission-Factor.pdf>.
Thurston, G. and M. Lippmann. 2015. Ambient Particulate Matter Air Pollution and Cardiopulmonary Diseases. Seminars in Respiratory and Critical Care Medicine 36(3): 422–32. doi:10.1055/s-0035-1549455.
U.S. Energy Information Administration (EIA). 2020. 2020 Residential Energy Consumption Survey (RECS): Housing Characteristics [Data Set]. Retrieved August 24, 2025. <https://www.eia.gov/consumption/residential/data/2020/index.php?view=characteristics#fueluses>.
Varner, C. 2023. Emergency Departments Are in Crisis Now and for the Foreseeable Future. CMAJ 195(24): E851–52. doi:10.1503/cmaj.230719.
World Health Organization (WHO). 2025, December 16. Household Air Pollution. Retrieved December 25, 2025. <https://www.who.int/news-room/fact-sheets/detail/household-air-pollution-and-health>.
Comments
Be the first to comment on this!
This article is for subscribers only. To view the entire article
Related Articles


Note: Please enter a display name. Your email address will not be publically displayed